 English
  Русский
 Bahasa Indonesia
 Bahasa Malay
 ไทย
ไทย Español
 Deutsch
 Български
 Français
 Tiếng Việt
 中文
中文 বাংলা
বাংলা हिन्दी
 Čeština
 Українська
 Română

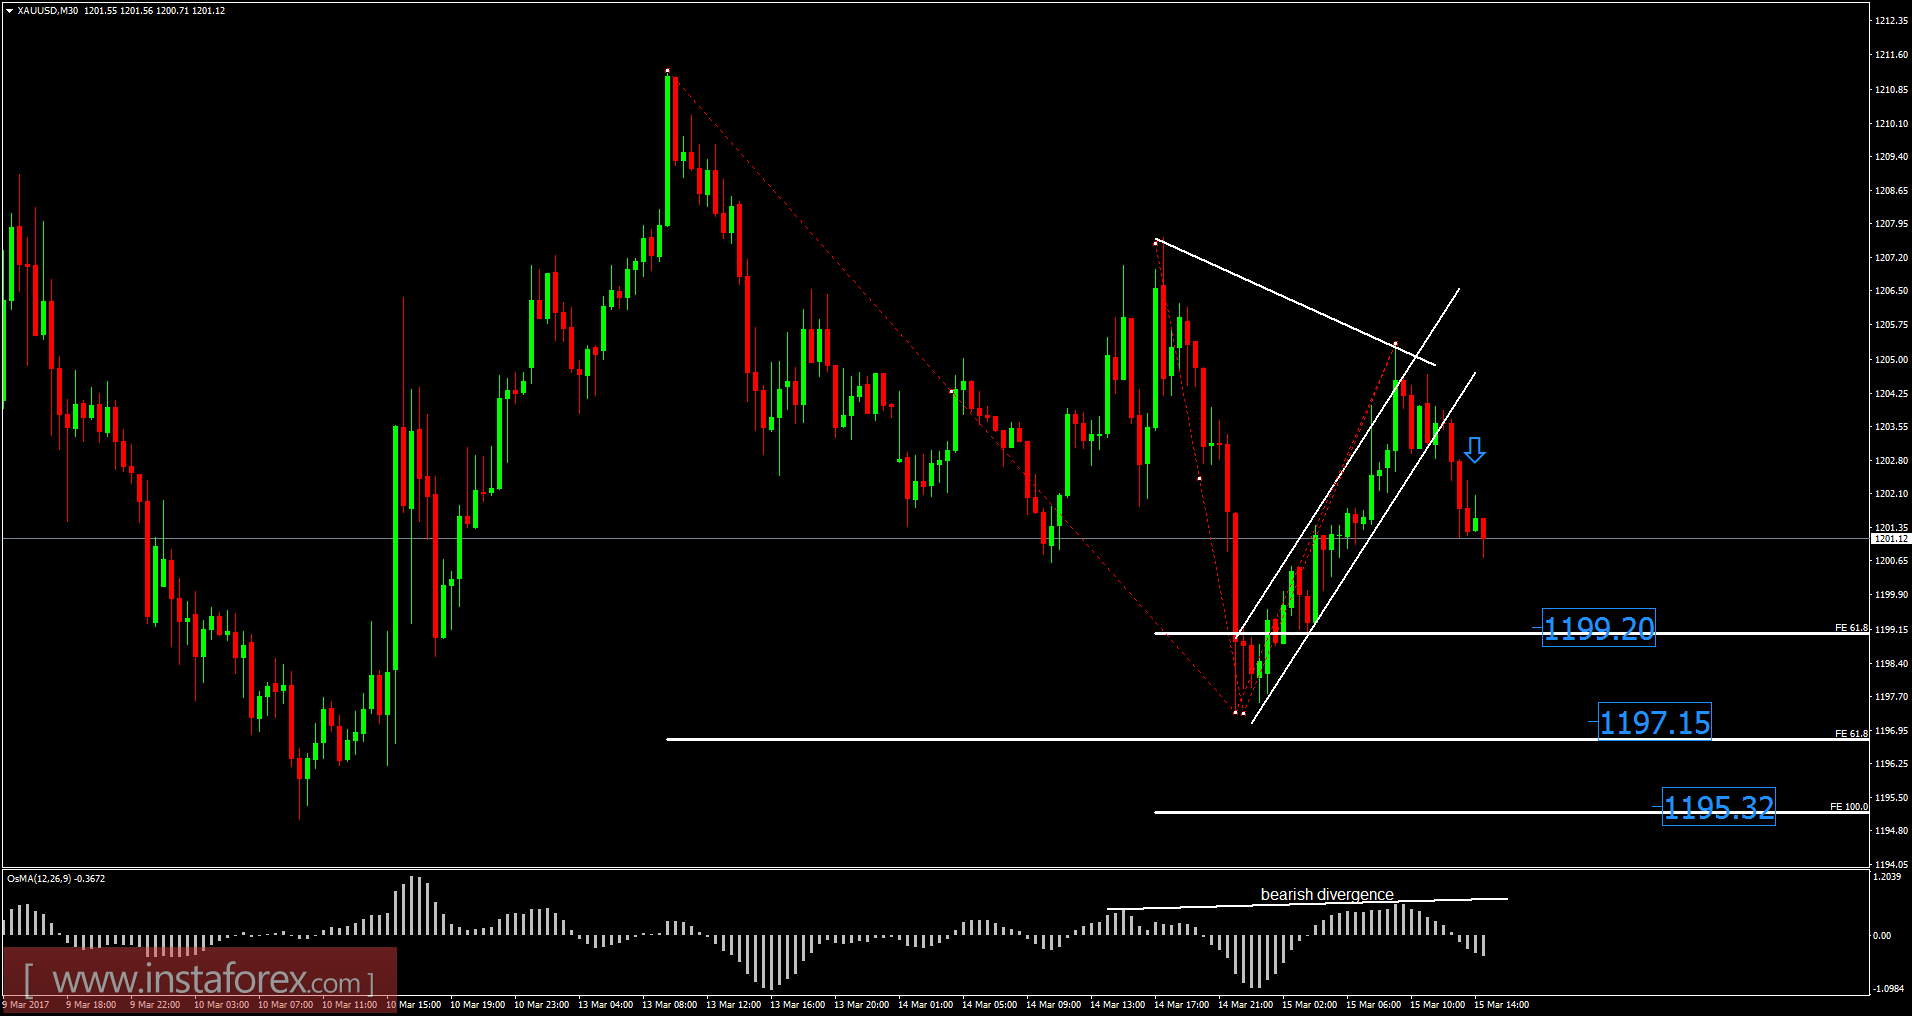
Recently, Gold has been trading sideways around the price of $1,200. According to the 30M time frame, I found a broken upward channel (bearish flag), which is a sign that buying looks risky. I have placed Fibonacci expansion to find potential downward targets. I got Fibonacci expansion 61.8% at the price of $1,199.00-$1,197.15 and Fibonacci expansion 100% at the price of $1,195.30. My advice is to watch for potential selling opportunities. There is also a bearish divergence on the moving average oscilator, which is another sign of weakness.
Resistance levels:
R1: $1,205.00
R2: $1,207.00
R3: $1,210.60
Support levels:
S1: $1,198.00
S2: $1,195.50
S3: $1,192.40
Trading recommendations for today: watch for potential selling opportunities.