 English
  Русский
 Bahasa Indonesia
 Bahasa Malay
 ไทย
ไทย Español
 Deutsch
 Български
 Français
 Tiếng Việt
 中文
中文 বাংলা
বাংলা हिन्दी
 Čeština
 Українська
 Română

GBP/USD crawled up during Wednesday's session following FOMC's decision to hike rates by 25 basis points as expected. Currently, the pair is facing the resistance zone of 1.2300, where bulls are trying to push higher in order to test the 1.2409 level as the next key hurdle for buyers. However, if the pair manages to pull back at such level, we can expect a decline to test the 1.2200 handle.
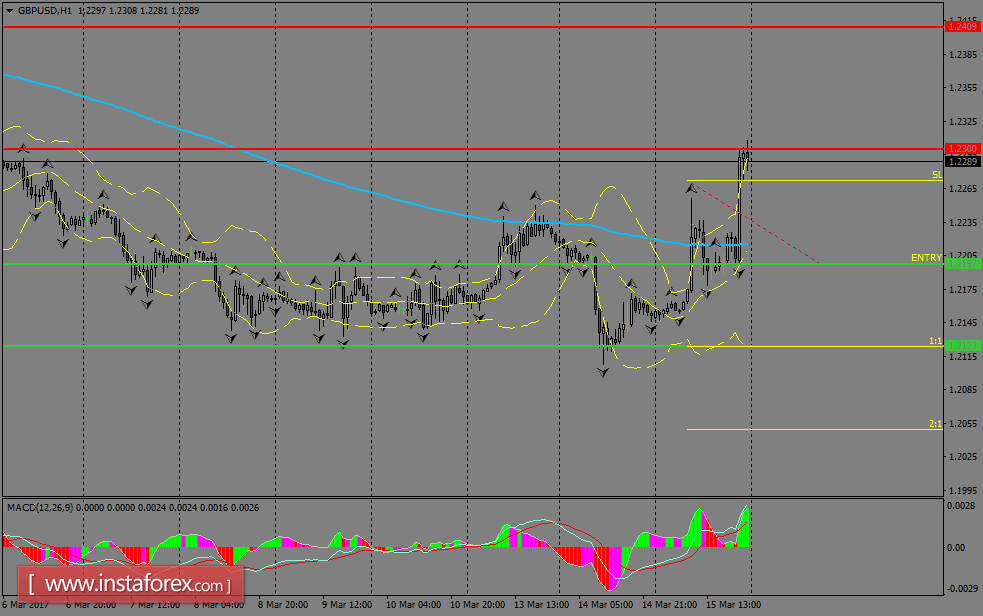
H1 chart's resistance levels: 1.2300 / 1.2409
H1 chart's support levels: 1.2197 / 1.2123
Trading recommendations for today: Based on the H1 chart, sell (short) orders only if the GBP/USD pair breaks a bearish candlestick; the support level is at 1.2197, take profit is at 1.2123 and stop loss is at 1.2272.