Gold held support yesterday and broke above the short-term trading range. The price breached the first short-term resistance at $1,211 and moved directly to $1,220 which was our first target. However, gold stays below resistance. My longer-term view remains bullish.
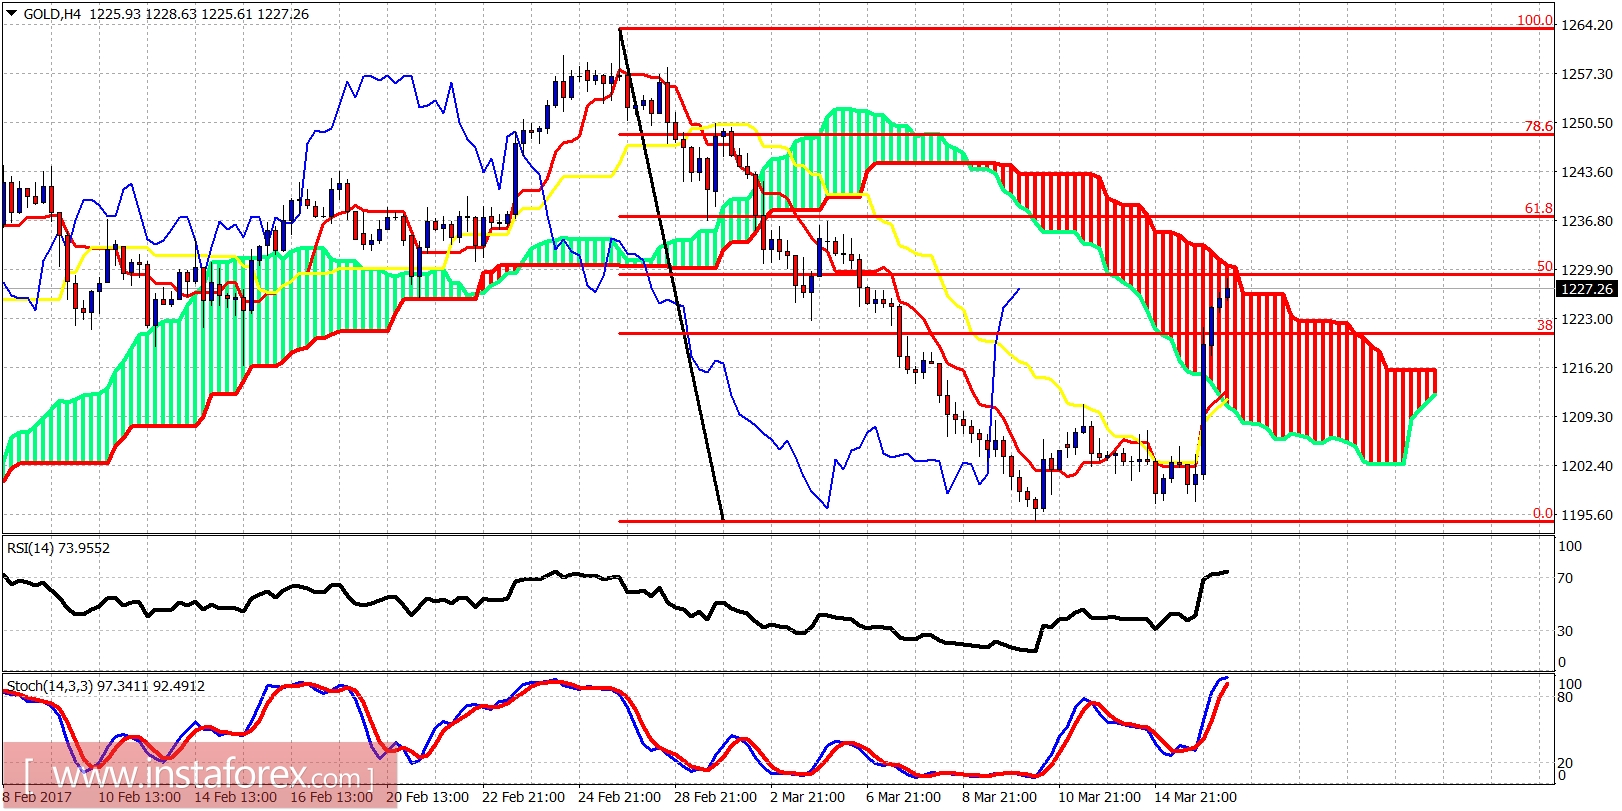
Gold price has reached the 50% Fibonacci retracement of the recent decline from the February highs. Currently, the support lies at $1,210. Breaking below it will increase the chances of
moving lower to $1,194 and then towards $1,170-60.
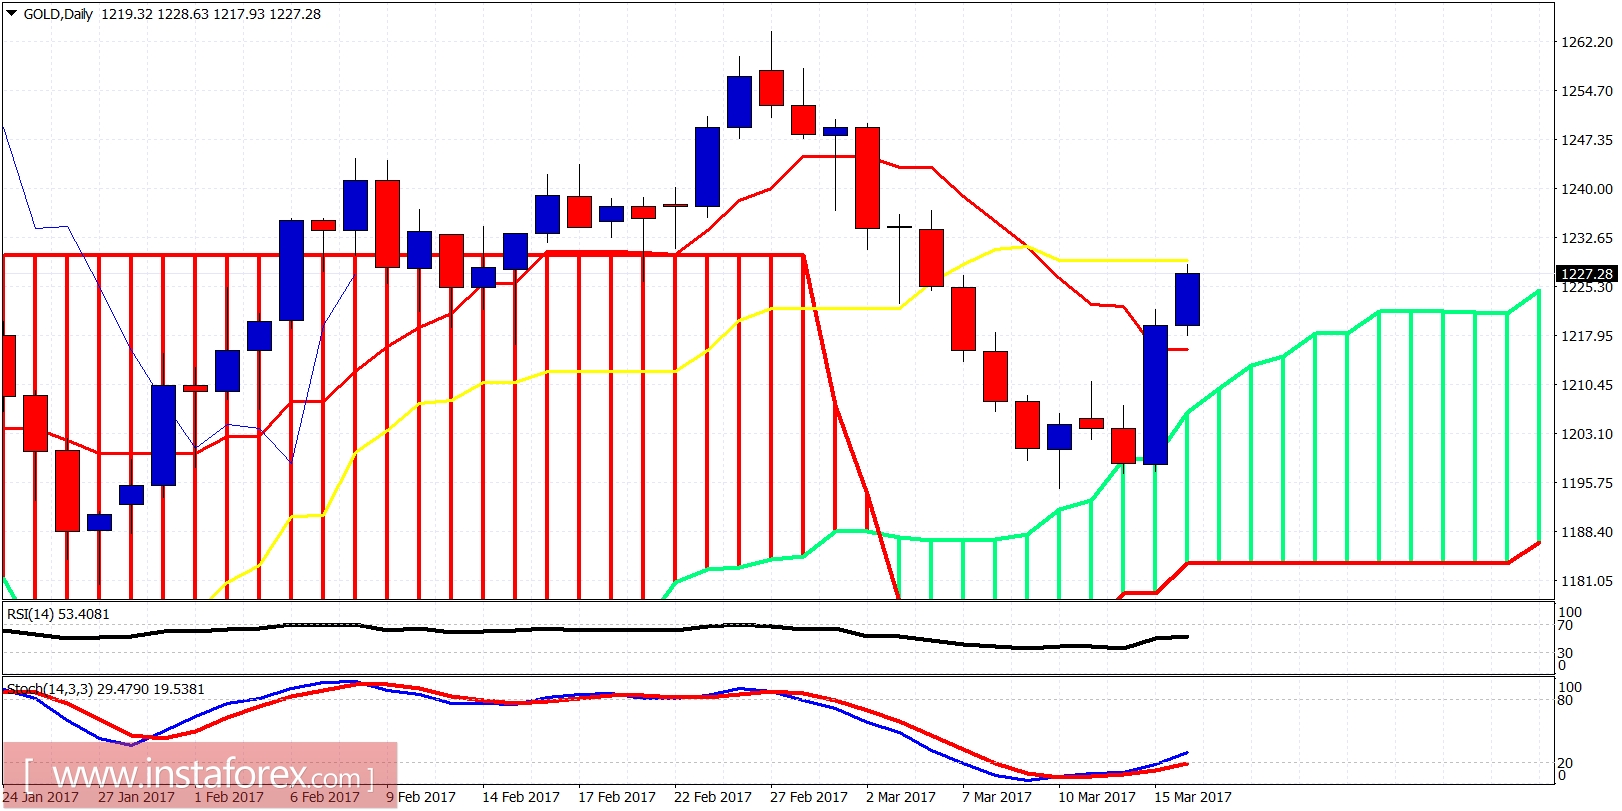
Gold daily candle has bounced off the daily cloud support exactly as we wanted and expected. The price is now testing important daily cloud resistance around $1,230. Gold needs to make higher highs and higher lows and hold above $1,194. Otherwise, the correction will be deeper and could reach even $1,160.
*The market analysis posted here is meant to increase your awareness, but not to give instructions to make a trade
 English
  Русский
 Bahasa Indonesia
 Bahasa Malay
 ไทย
ไทย Español
 Deutsch
 Български
 Français
 Tiếng Việt
 中文
中文 বাংলা
বাংলা हिन्दी
 Čeština
 Українська
 Română
