 English
  Русский
 Bahasa Indonesia
 Bahasa Malay
 ไทย
ไทย Español
 Deutsch
 Български
 Français
 Tiếng Việt
 中文
中文 বাংলা
বাংলা हिन्दी
 Čeština
 Українська
 Română

The pair managed to rally above the 200 SMA and it's heading towards 1.2400. Following the FOMC decision, GBP/USD is poised to extend its upward path until the 1.2512 level. If the pair develops another bullish pattern, then it's likely to reach the 1.2600 handle. MACD indicator is entering the negative territory, favoring a corrective move.
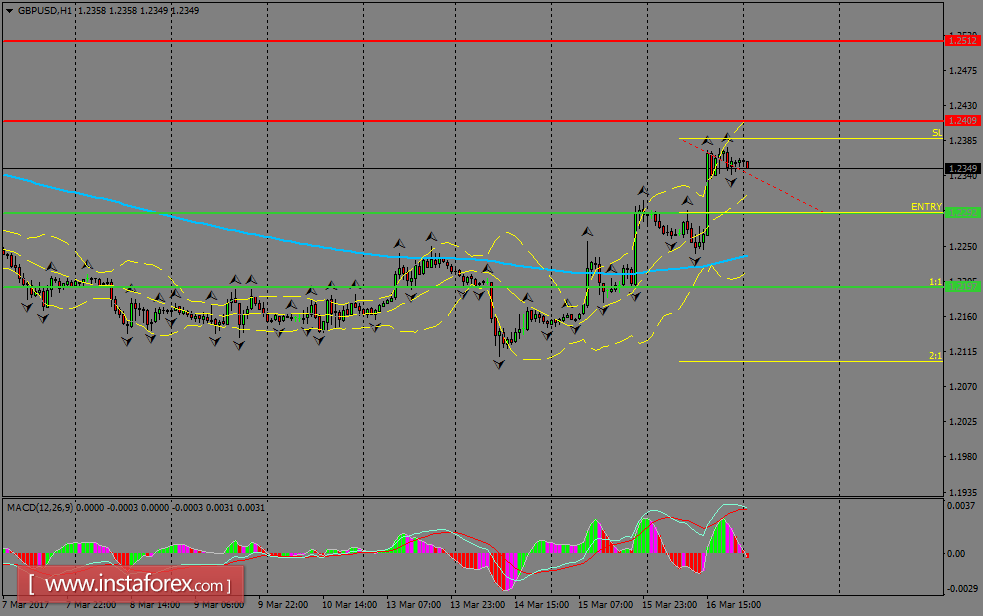
H1 chart's resistance levels: 1.2409 / 1.2512
H1 chart's support levels: 1.2292 / 1.2197
Trading recommendations for today: Based on the H1 chart, sell (short) orders only if the GBP/USD pair breaks a bearish candlestick; the support level is at 1.2292, take profit is at 1.2197 and stop loss is at 1.2387.