 English
  Русский
 Bahasa Indonesia
 Bahasa Malay
 ไทย
ไทย Español
 Deutsch
 Български
 Français
 Tiếng Việt
 中文
中文 বাংলা
বাংলা हिन्दी
 Čeština
 Українська
 Română

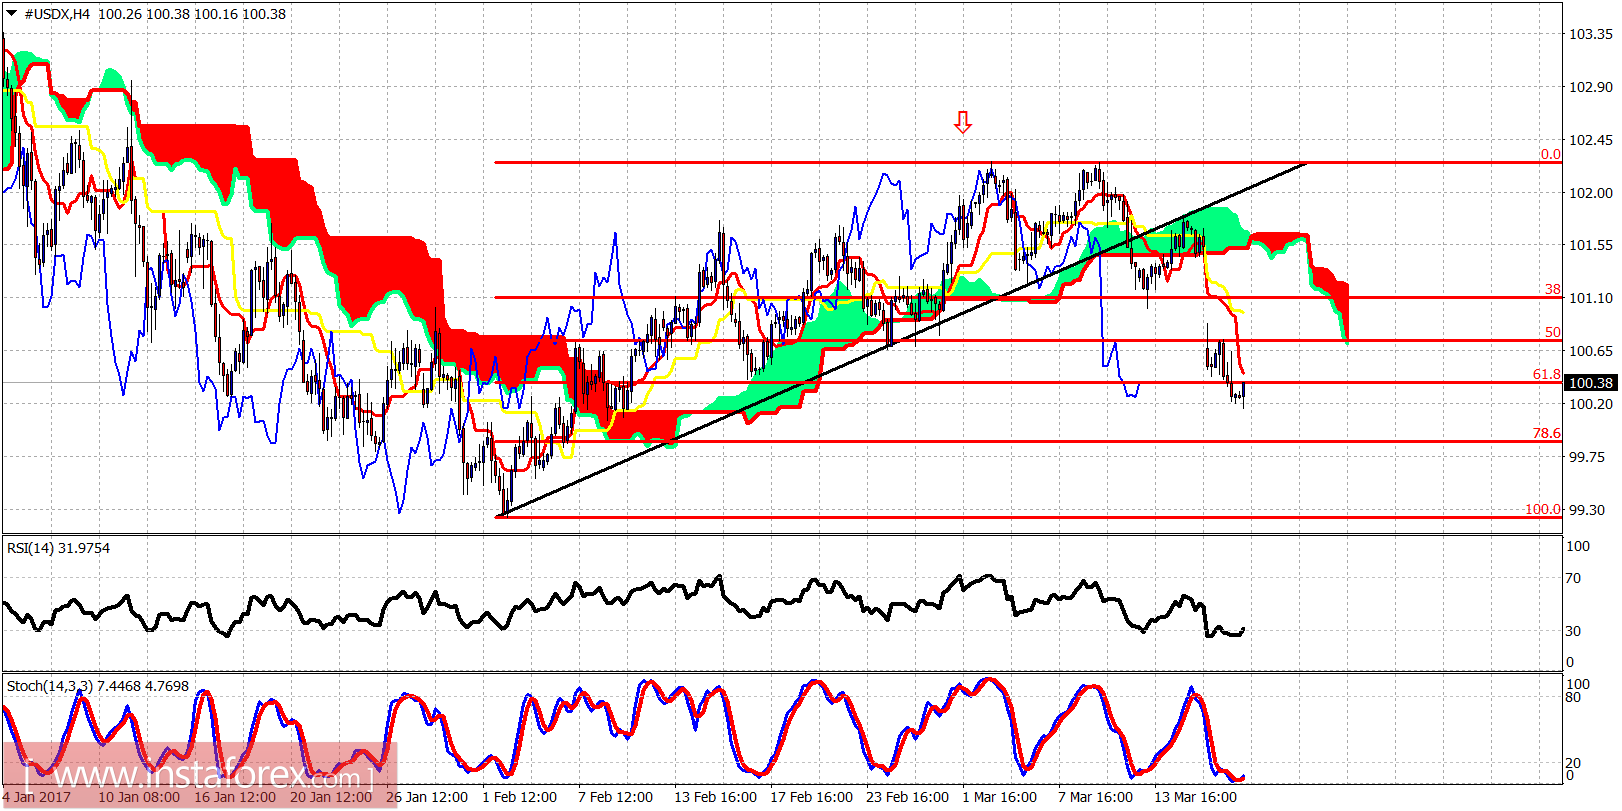
The Dollar index has broken through the 61.8% Fibonacci retracement support but it shows reversal signs. Short-term trend is bearish. Medium-term trend is neutral. Long-term trend remains bullish.
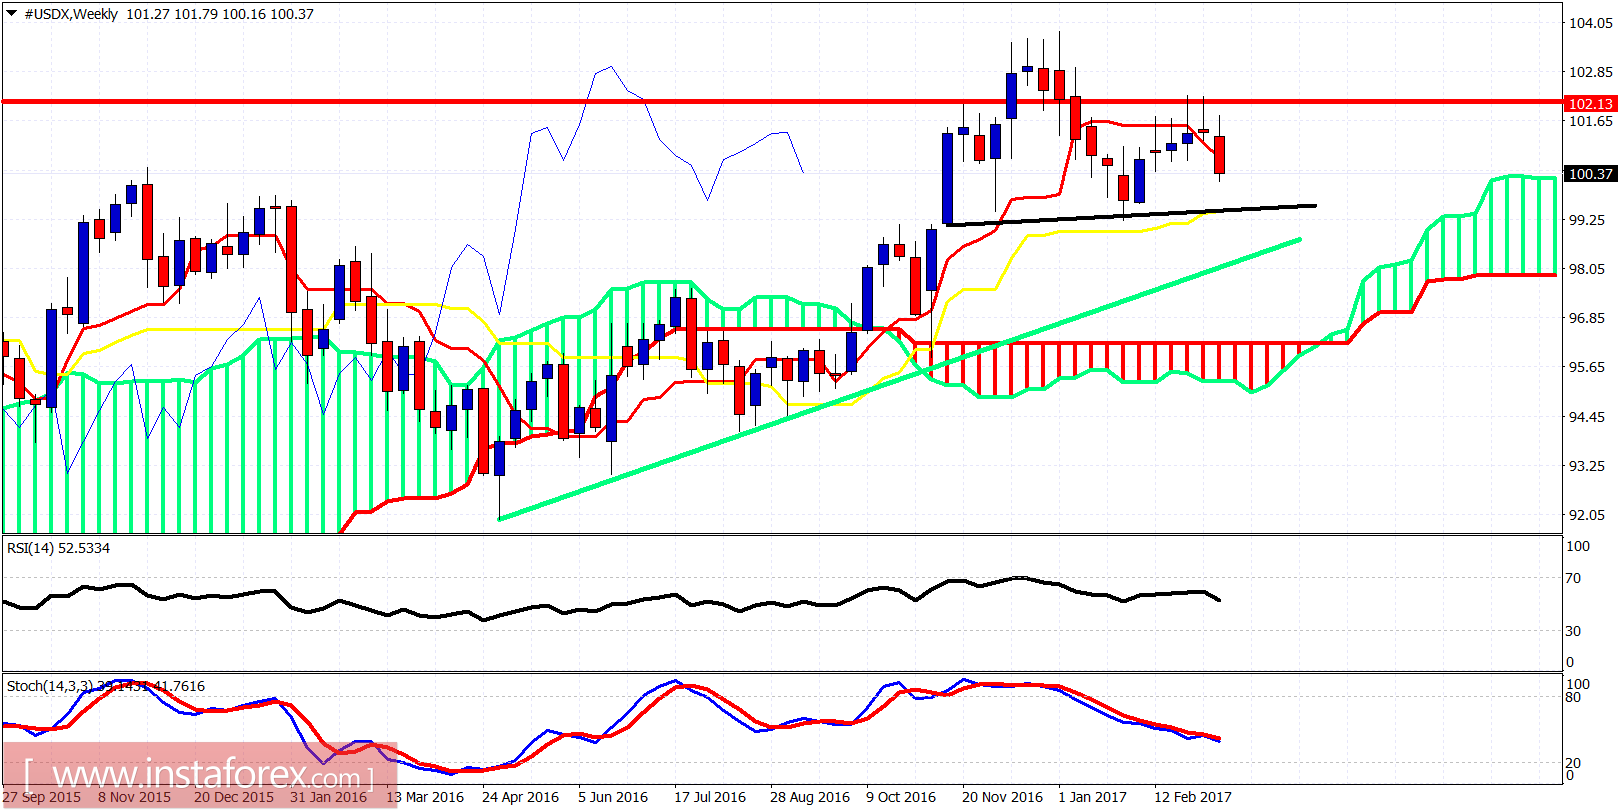
Black line - neckline support
Green line - long-term trend line support
The Dollar index is most probably forming a right hand shoulder in a bearish Head and Shoulders pattern that has a neckline support (black line) at 99.25. The Dollar index has broken below the weekly tenkan-sen (Red line indicator) and is heading towards the kijun-sen support (yellow line indicator). Important weekly resistance is at 101.80 and at 102.30. Bears are in control. Bulls need to show more constructive price action above at least 101.80 in order to regain control.