English
  Русский
 Bahasa Indonesia
 Bahasa Malay
 ไทย
ไทย Español
 Deutsch
 Български
 Français
 Tiếng Việt
 中文
中文 বাংলা
বাংলা हिन्दी
 Čeština
 Українська
 Română

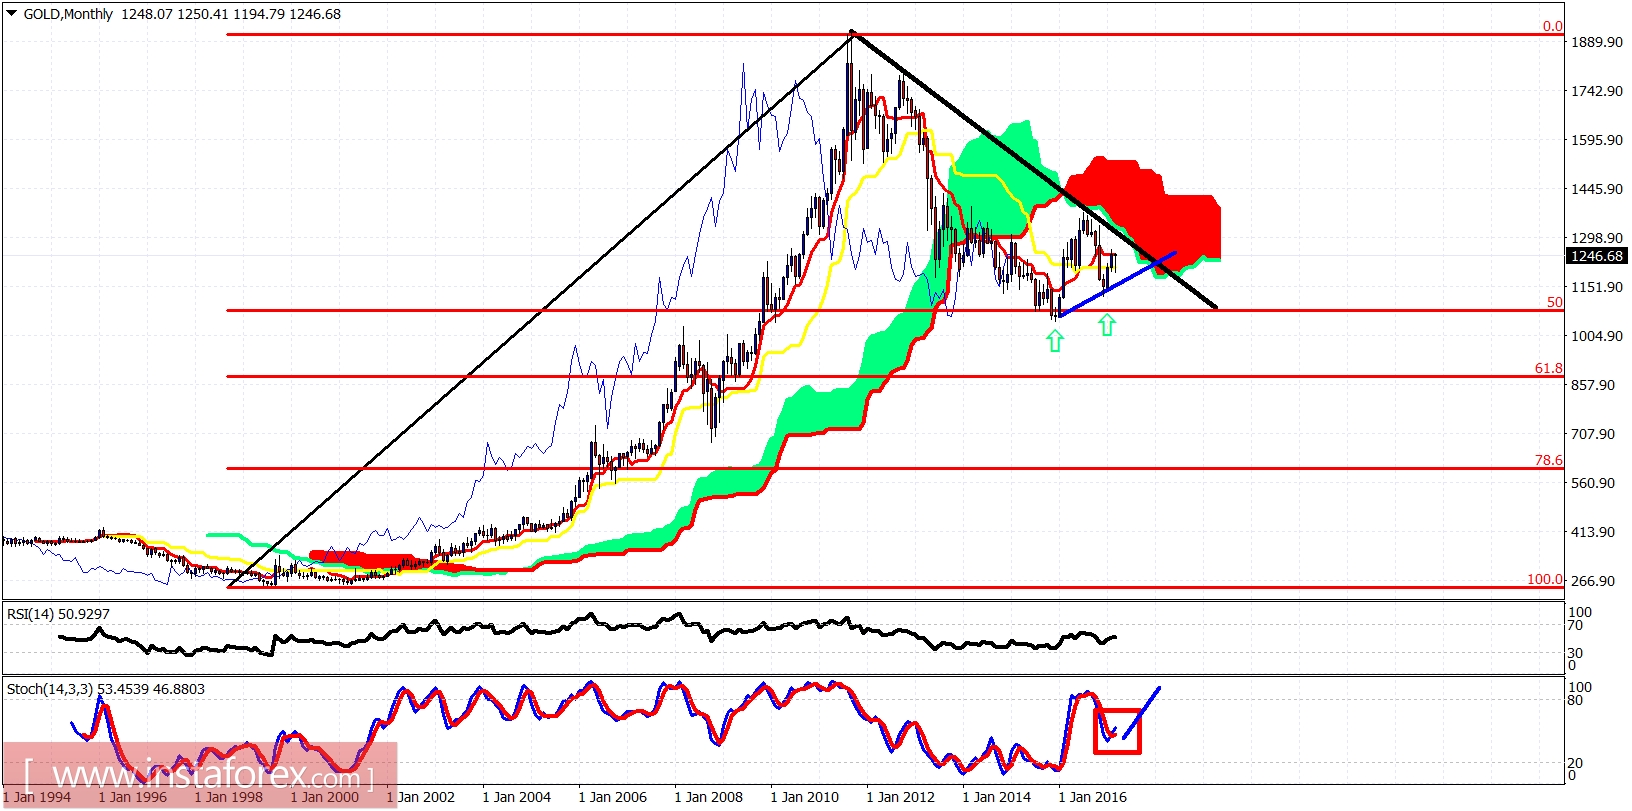
Gold is rising within an impulsive pattern. The price is in an uptrend. After making an important low at $1,194, gold is rising and is expected to move towards the key monthly resistance at $1,325. In the short term, gold prices are close or has already completed 5 waves up from $1,194.
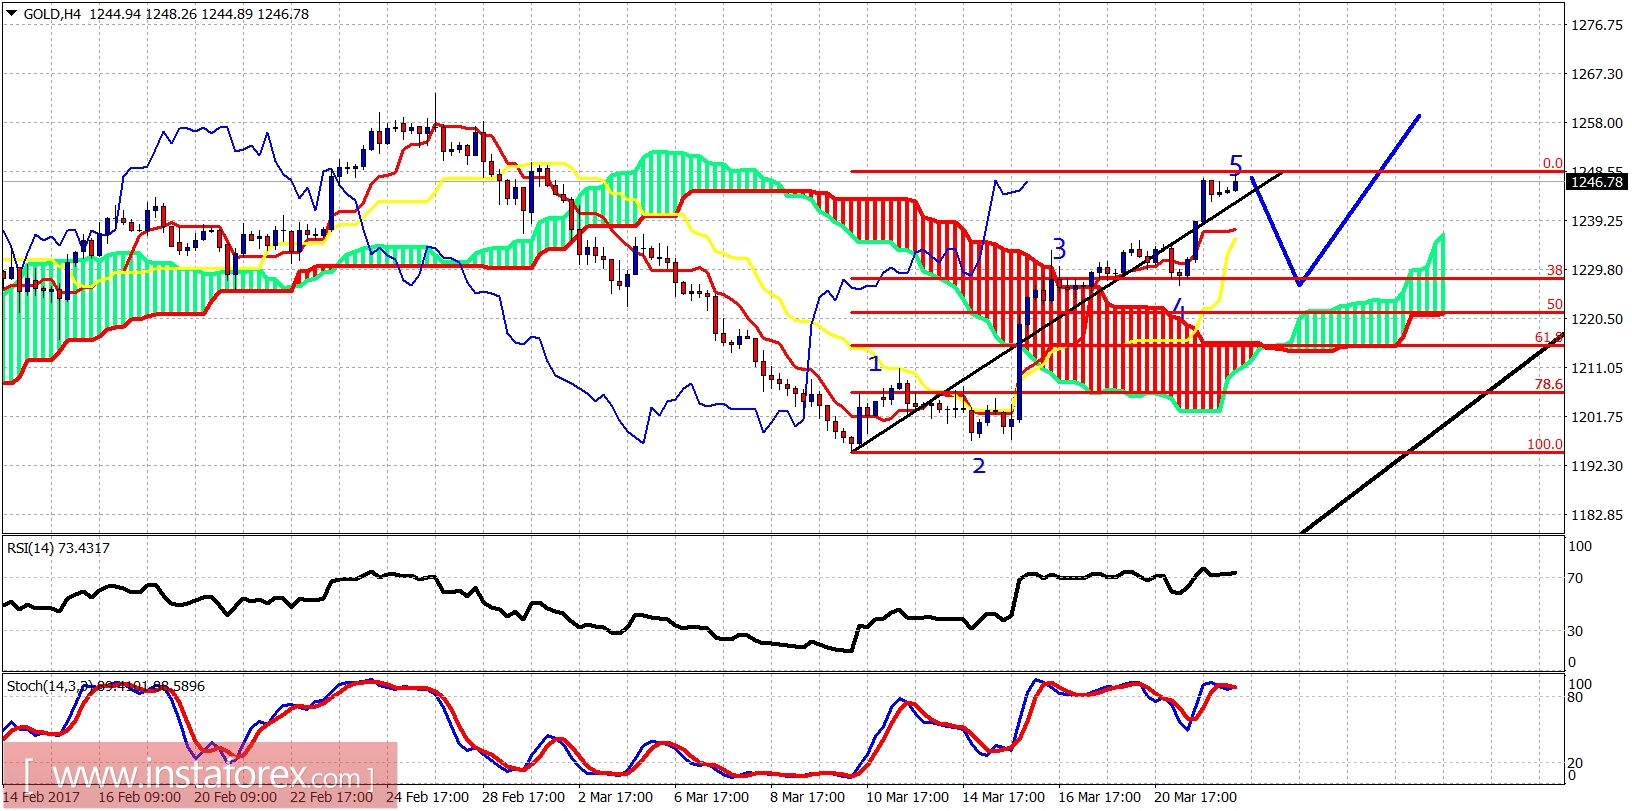
Gold is trading above the Ichimoku cloud. The short-term trend is bullish. The price may pull back towards the Ichimoku cloud and the 38% Fibonacci retracement. Gold has made an important low at $1,194 and as long as we trade above it, we are aggressively bullish.