 English
  Русский
 Bahasa Indonesia
 Bahasa Malay
 ไทย
ไทย Español
 Deutsch
 Български
 Français
 Tiếng Việt
 中文
中文 বাংলা
বাংলা हिन्दी
 Čeština
 Українська
 Română

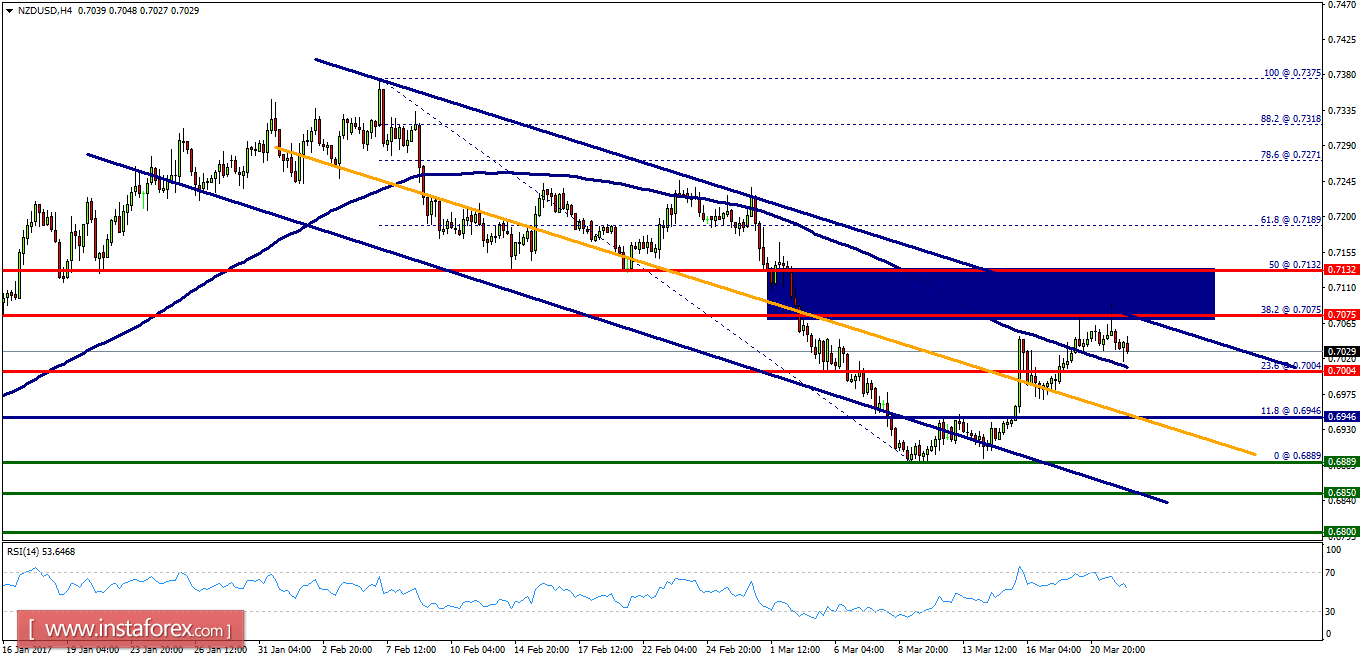
Overview:
- The NZD/USD pair is still trading around the area of 0.7075. Today, the level of 0.7075 represents the double top.
- The pair has already formed minor resistance at 0.7004 and the strong resistance is seen at the level of 0.7075 because it represents the weekly resistance 1.
- So, major resistance is seen at 0.7004, while immediate support is found at 0.6889.
- If the pair closes below the price of 0.6889, the NZD/USD pair may resume its movement to 0.6850 to test the daily support 2.
- We expect the NZD/USD pair to move between the levels of 0.7004 and 0.6850.
- The RSI is still calling for a strong bearish market. The current price is also below the moving average 100.
- As a result, sell below the double top of 0.7004 with targets at 0.6869 and 0.6850.
- However, stop loss should always be taken into account; accordingly, it will be useful to set the stop loss above the last bullish wave at the level of 0.7075 (double top).