 English
  Русский
 Bahasa Indonesia
 Bahasa Malay
 ไทย
ไทย Español
 Deutsch
 Български
 Français
 Tiếng Việt
 中文
中文 বাংলা
বাংলা हिन्दी
 Čeština
 Українська
 Română

GBP/USD is following the overall bullish bias across the board with a consolidation above the 200 SMA on the H1 chart. If the pair manages to break above 1.2512, then it can test the 1.2570 level, as the Cable is strengthening its structure in the short term. On the other side, if the Cable plunges below 1.2391, it can reach the 1.2292 level.
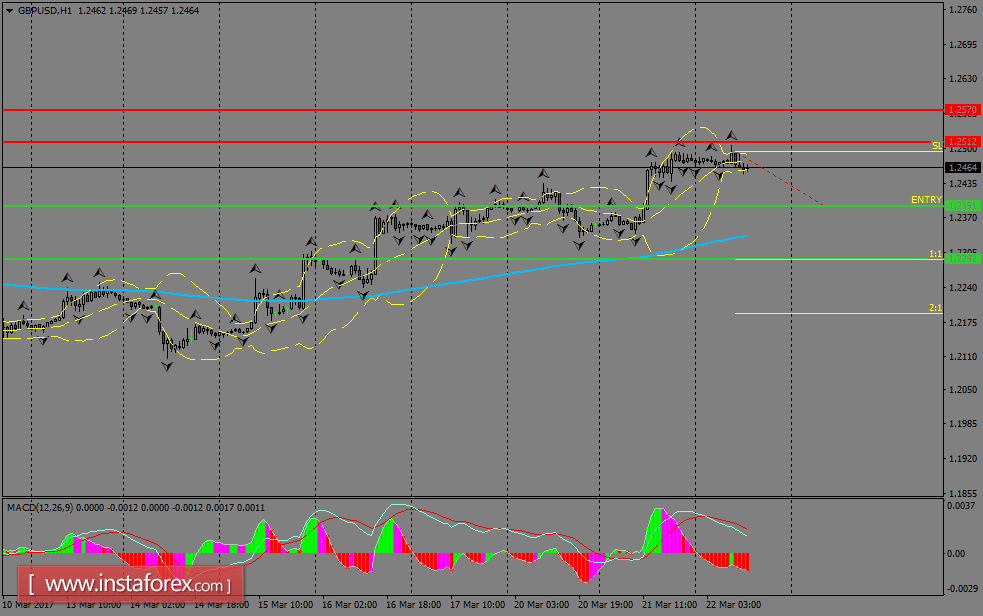
H1 chart's resistance levels: 1.2512 / 1.2570
H1 chart's support levels: 1.2391 / 1.2292
Trading recommendations for today: Based on the H1 chart, sell (short) orders only if the GBP/USD pair breaks a bearish candlestick; the support level is at 1.2391, take profit is at 1.2292 and stop loss is at 1.2493.