 English
  Русский
 Bahasa Indonesia
 Bahasa Malay
 ไทย
ไทย Español
 Deutsch
 Български
 Français
 Tiếng Việt
 中文
中文 বাংলা
বাংলা हिन्दी
 Čeština
 Українська
 Română

USDX is moving in a sideways structure still well supported by the 99.66 area as the bears are trying to gather some momentum in order to reach the 99.26 level and perform a deeper consolidation below the 200 SMA on the H1 chart. However, if the index does a break above 100.64, it can invalidate the near-term bearish scenario.
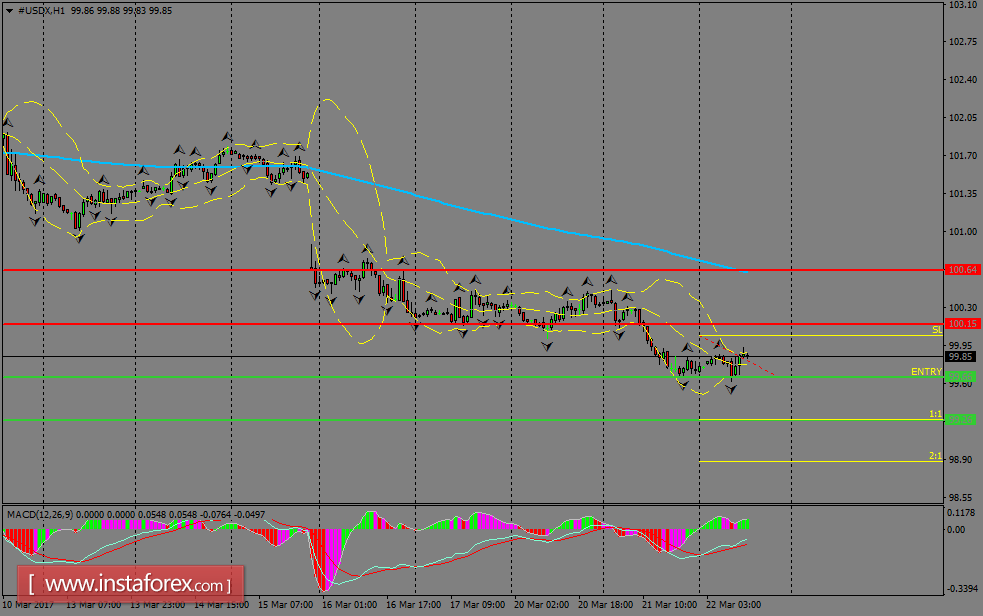
H1 chart's resistance levels: 100.15 / 100.64
H1 chart's support levels: 99.66 / 99.26
Trading recommendations for today: Based on the H1 chart, place sell (short) orders only if the USD Index breaks with a bearish candlestick; the support level is at 99.66, take profit is at 99.26 and stop loss is at 100.04.