 English
  Русский
 Bahasa Indonesia
 Bahasa Malay
 ไทย
ไทย Español
 Deutsch
 Български
 Français
 Tiếng Việt
 中文
中文 বাংলা
বাংলা हिन्दी
 Čeština
 Українська
 Română

S&P 500 is consolidating its structure below the 200 SMA at H1 chart and the support zone of 2339.3 is now being challenged in the short-term. To witness further weakness, we should see first a breakout below that zone in order to reach the next key area around 2330. In the other side, if the index manages to break above 2335.7, it can rally towards 2365.5 in a first degree.
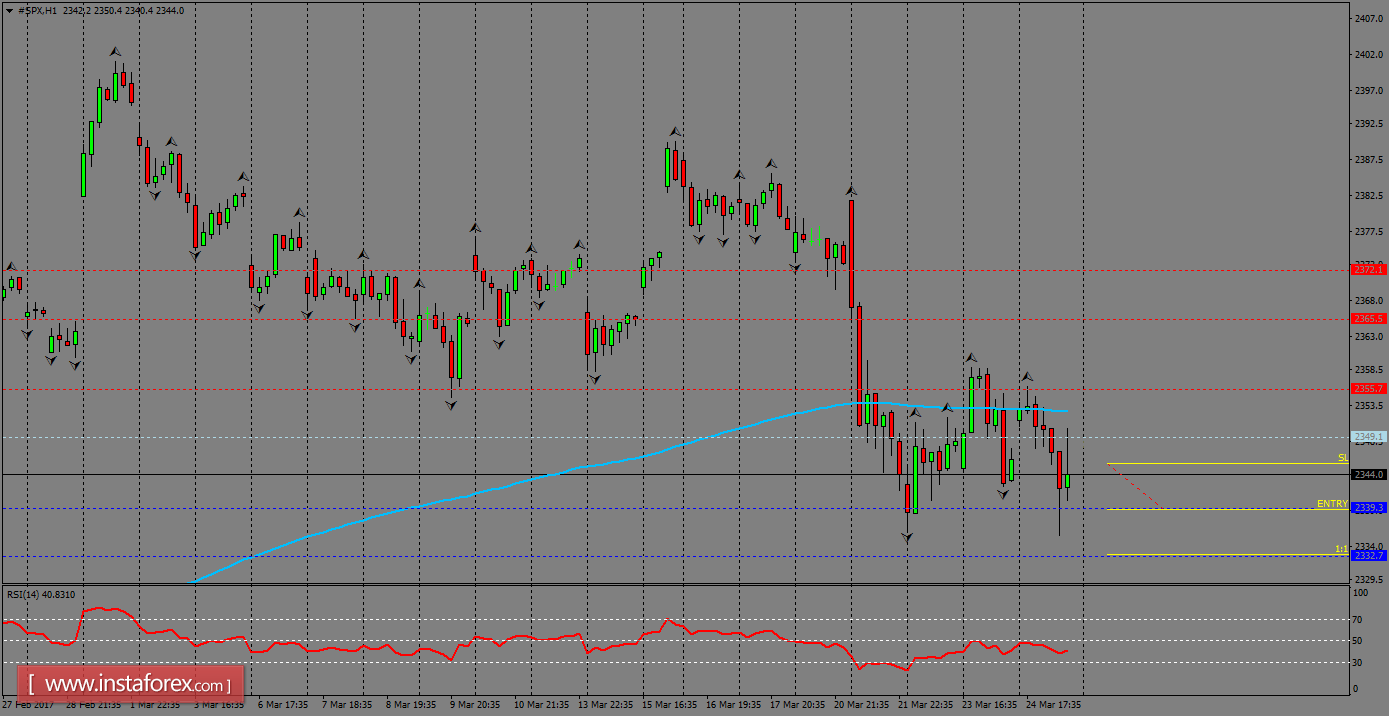
Trading recommendations for today: Based on the H1 chart, place sell (short) orders only if the SP 500 breaks a bearish candlestick; the support level is at 2339.3, take profit is at 2332.7, and stop loss is at 2345.4.