 English
  Русский
 Bahasa Indonesia
 Bahasa Malay
 ไทย
ไทย Español
 Deutsch
 Български
 Français
 Tiếng Việt
 中文
中文 বাংলা
বাংলা हिन्दी
 Čeština
 Українська
 Română

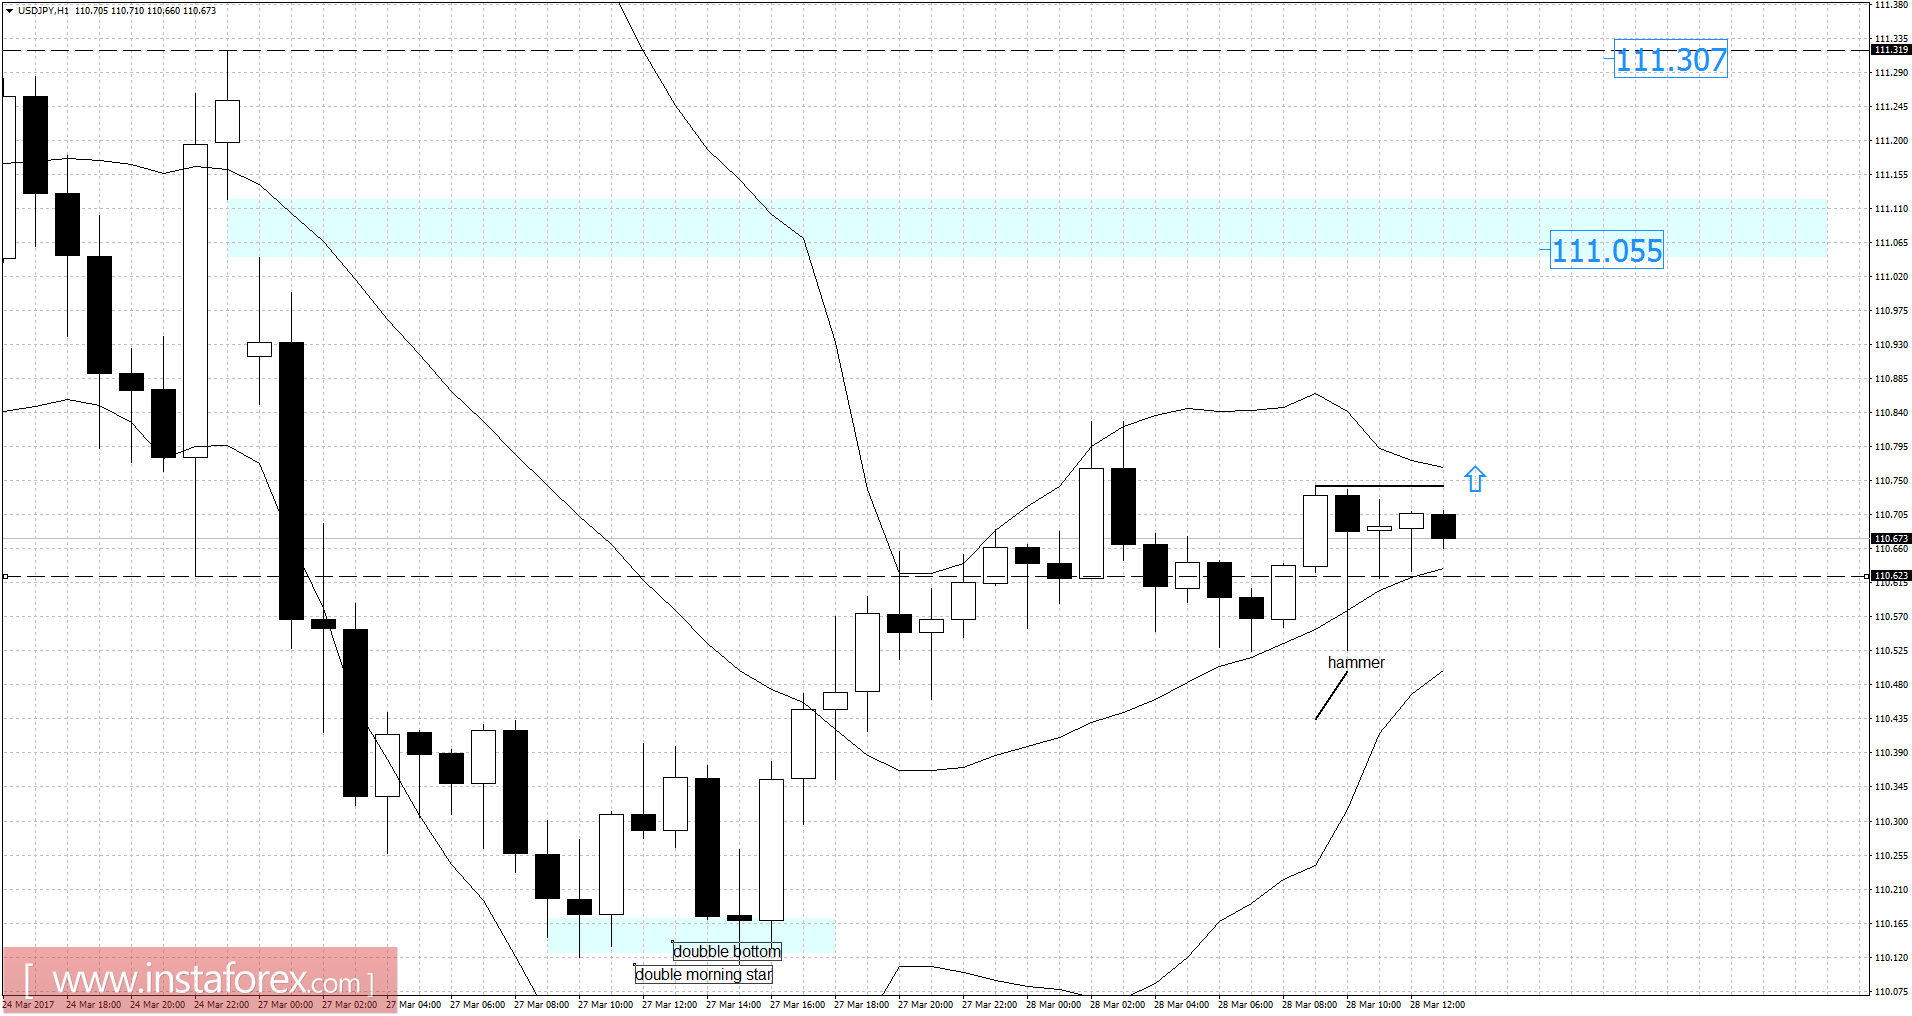
Recently, the USD/JPY pair has been trading upwards. The price tested the level of 110.82. According to the 1H time frame, I found the double bottom in the background and the double morning star formation, which is a sign that selling looks risky. Most recently, the hammer candlestick pattern has been formed, which is another sign that buyers are in control. Watch for potential buying opportunities if the price breaks the level of 110.75. Targets are set at 111.05 and 111.30.
Resistance levels:
R1: 111.10
R2: 111.40
R3: 111.85
Support levels:
S1: 110.20
S2: 109.95
S3: 109.50
Trading recommendations for today: watch for potential buying opportunities.