 English
  Русский
 Bahasa Indonesia
 Bahasa Malay
 ไทย
ไทย Español
 Deutsch
 Български
 Français
 Tiếng Việt
 中文
中文 বাংলা
বাংলা हिन्दी
 Čeština
 Українська
 Română

Gold price continues to trade below important resistance of $1,250-55 inside a bearish channel. Gold could continue towards $1,240 but overall we remain bullish looking for $1,300-$1,320 over the next couple of weeks.
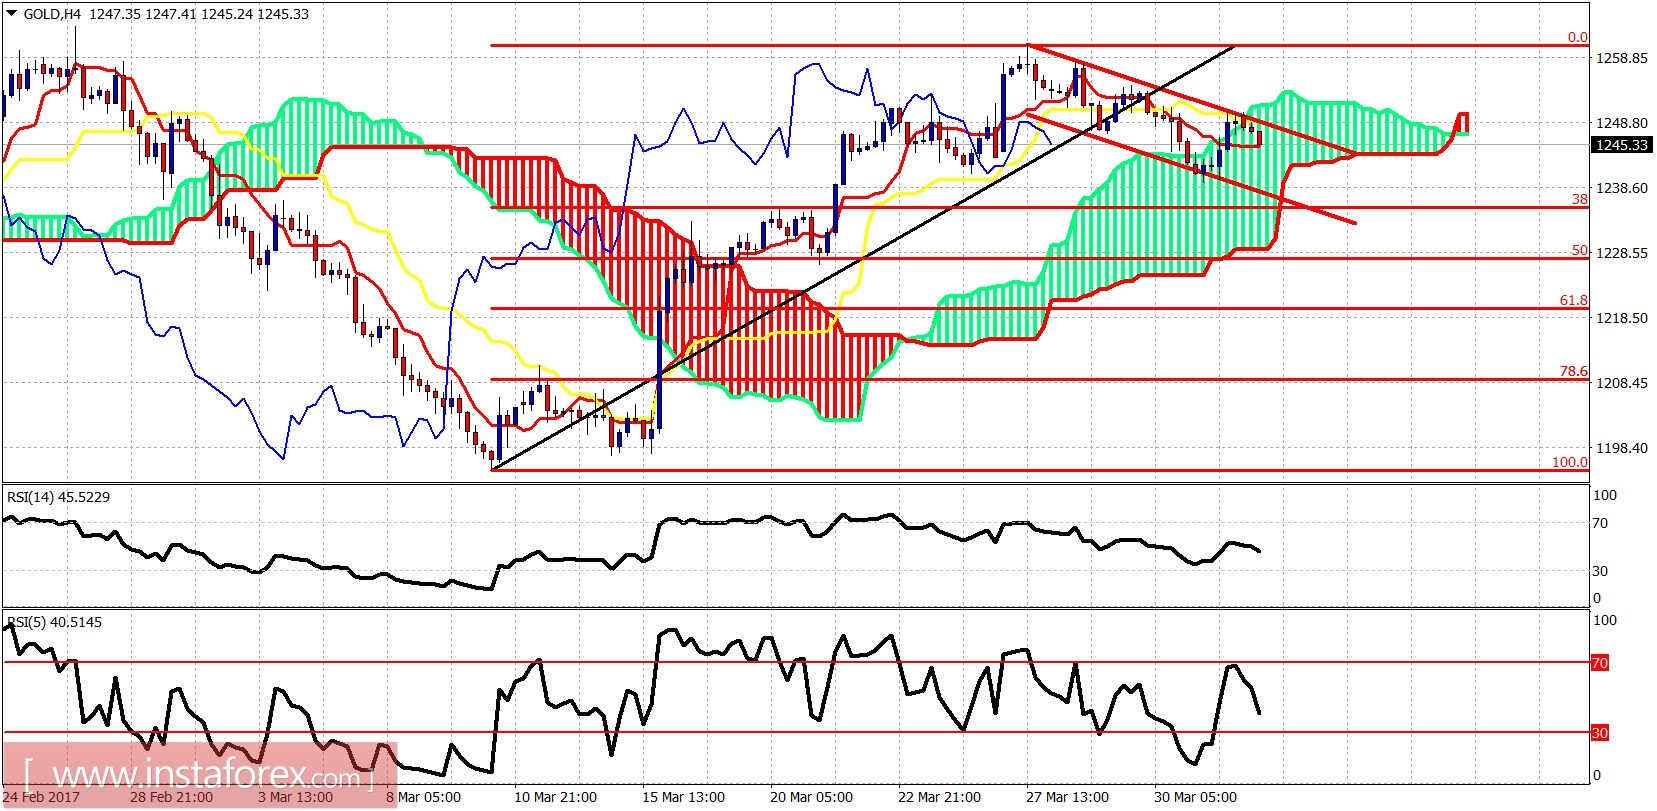
Short-term resistance is found at $1,252-55 area. Support is at $1,240. If resistance is broken I would expect Gold price to move towards $1,280. If support fails we should move towards $1,220. Short-term trend is neutral as the price is inside the cloud.
Blue line- long-term support
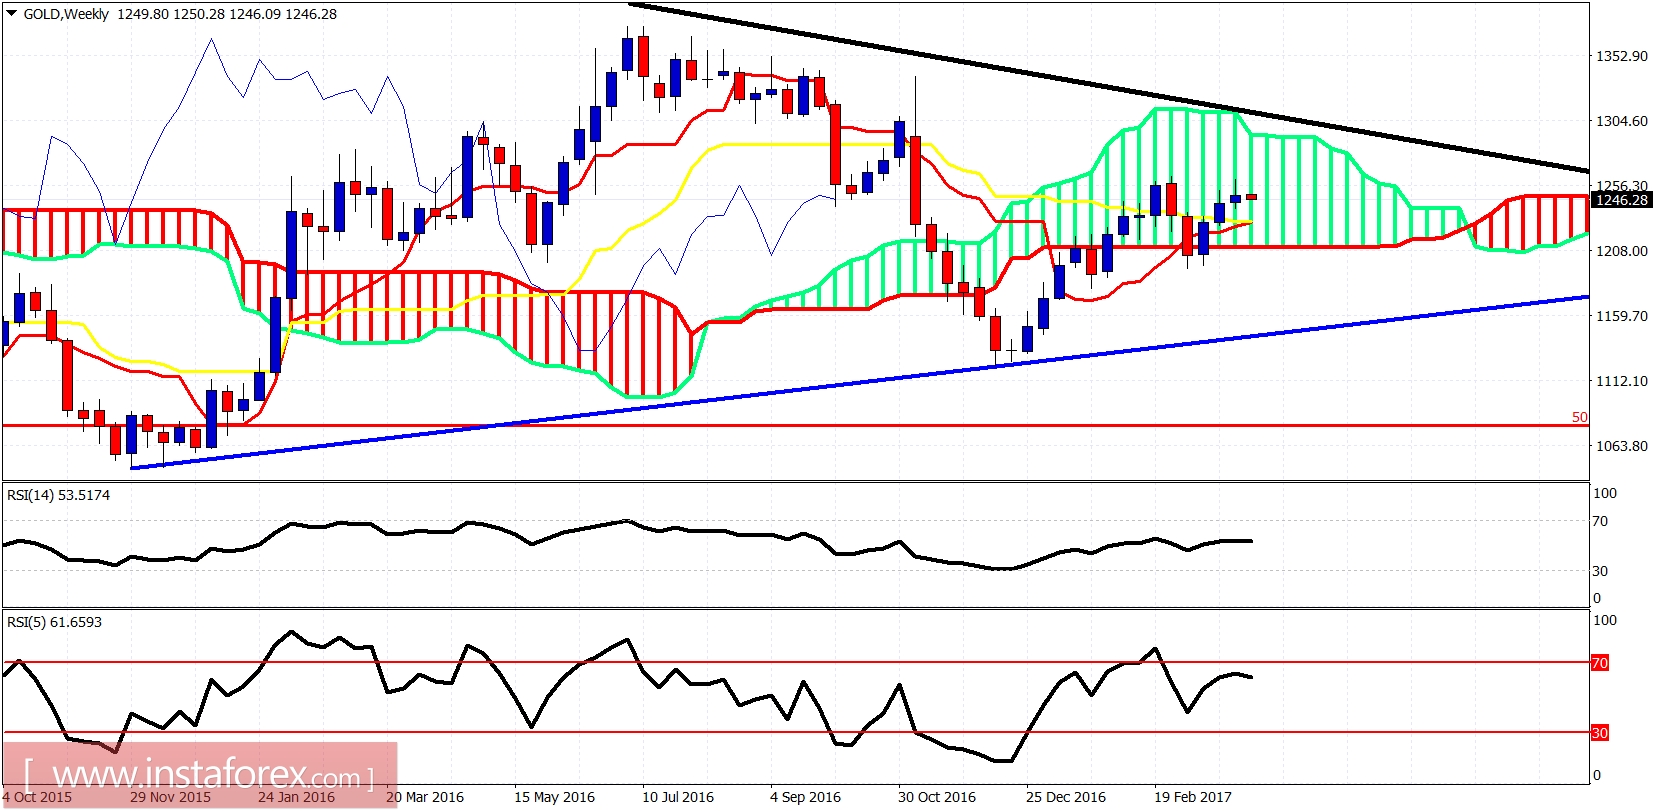
Gold is inside the weekly cloud. Long-term trend is neutral as long as the price is below the black trend line resistance. I expect this resistance trend line to be tested soon. The bulls must not break below the upwards sloping blue trend line support. This means that a break below $1,194 will be a bearish sign.