 English
  Русский
 Bahasa Indonesia
 Bahasa Malay
 ไทย
ไทย Español
 Deutsch
 Български
 Français
 Tiếng Việt
 中文
中文 বাংলা
বাংলা हिन्दी
 Čeština
 Українська
 Română

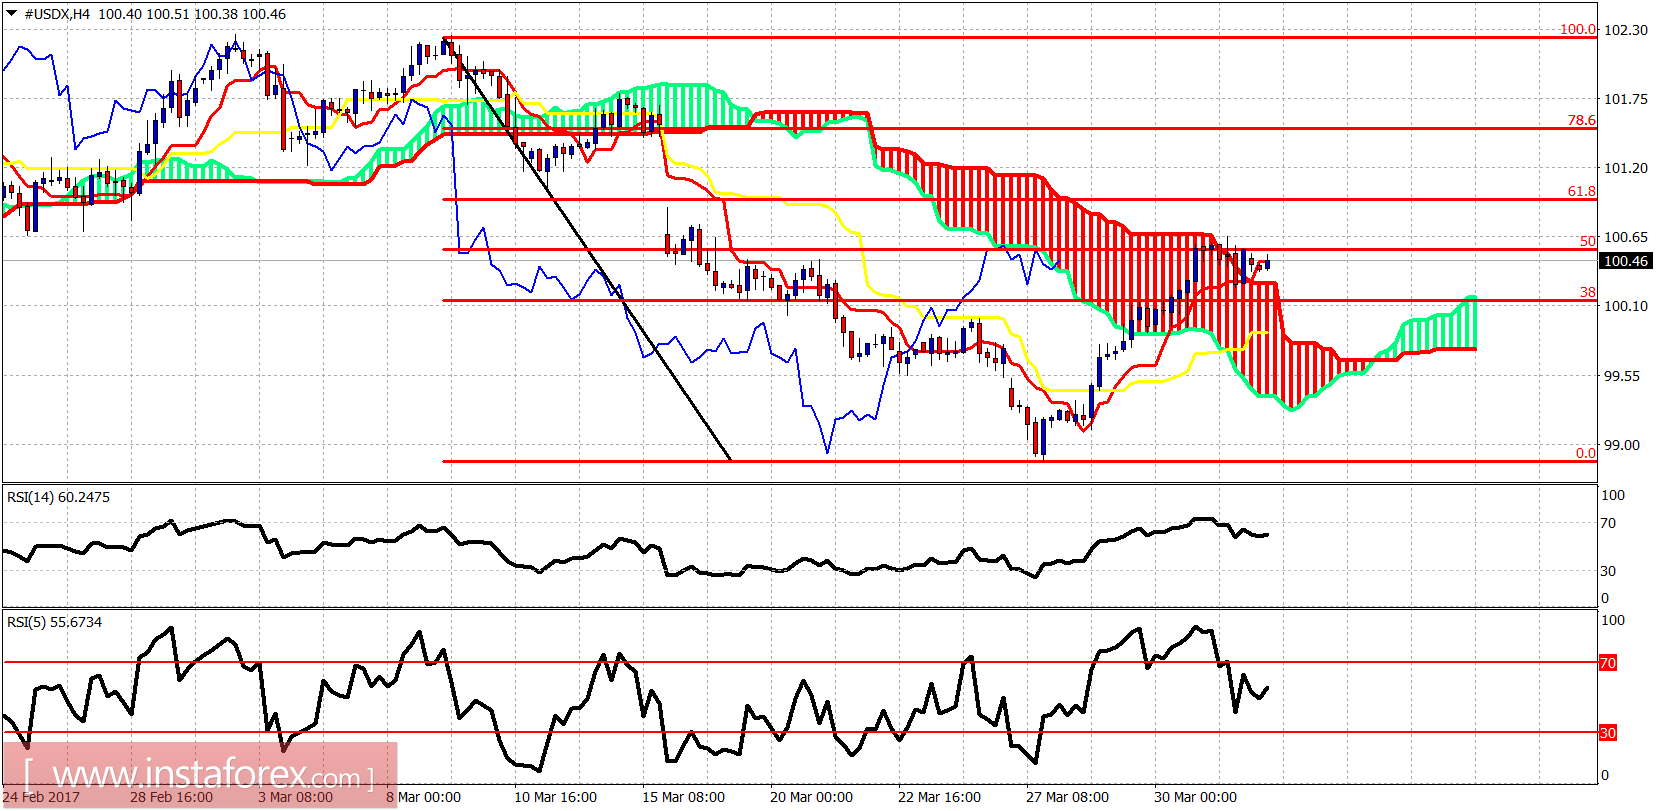
The Dollar index continued its bounce higher on Friday after the selling pressures in its main component the EUR/USD pair. Trend remains bullish in the short term as long as the price is trading above 100.20. There are signs of a correction coming. The next pullback will be very important.
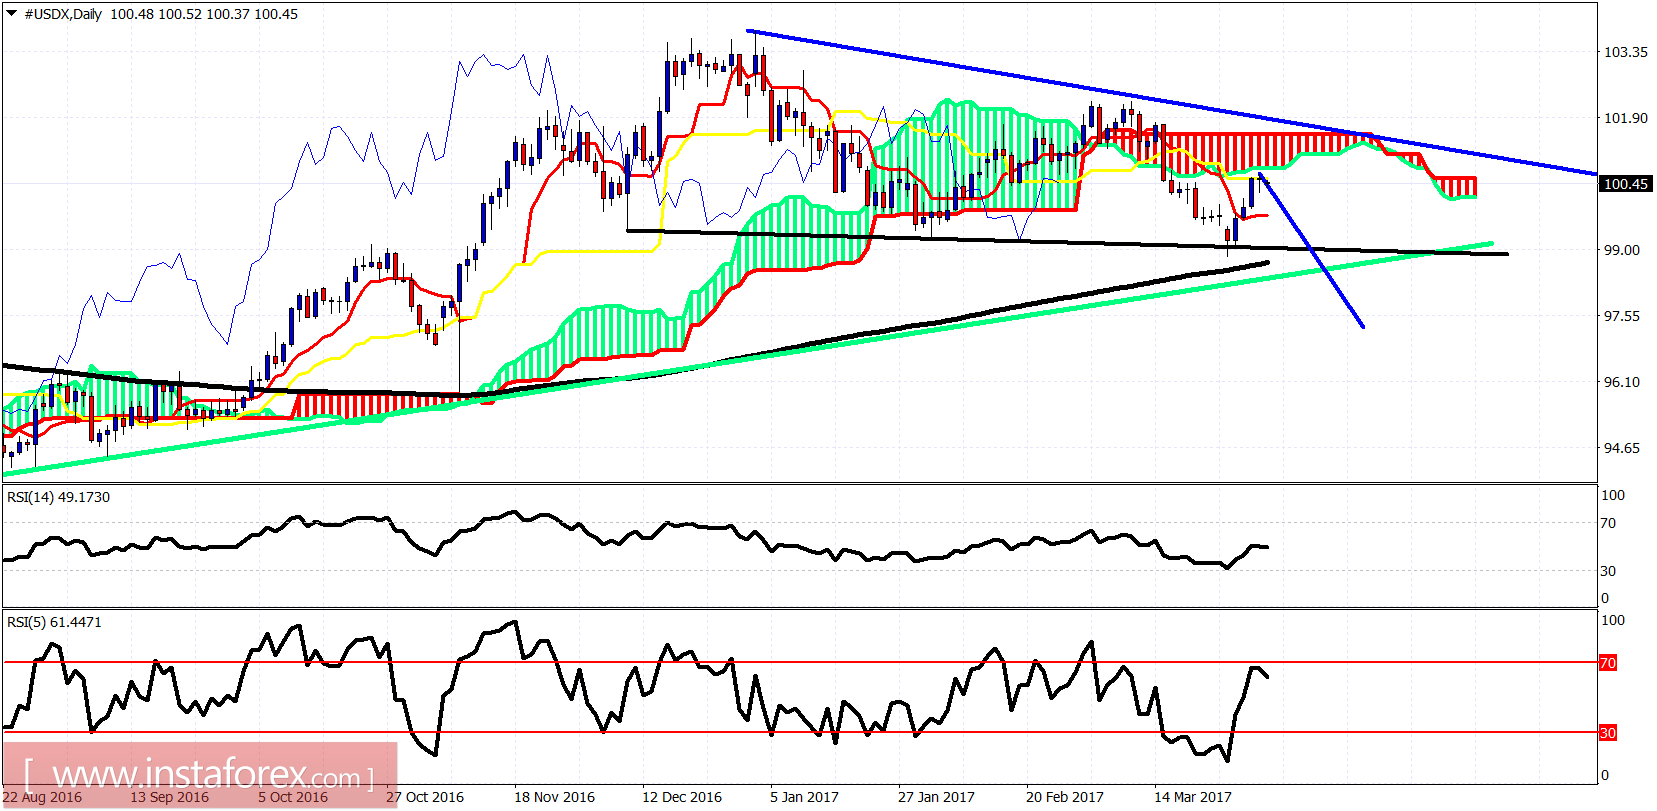
Black line - neckline support
Green line - long-term trend line support
The Dollar index is bouncing towards the Ichimoku cloud in the daily chart. The 100.80 level is important daily resistance. A rejection here and a lower high will be a bearish signal frontrunning another selling pressure to push the index below the black neckline support. Another break below the black neckline support will be a very bearish sign. Breaking the green trend line support will also be a bearish sign. On the other hand, the bulls need to break above 101.80-102 price area in order to strengthen the bullish scenario.