 English
  Русский
 Bahasa Indonesia
 Bahasa Malay
 ไทย
ไทย Español
 Deutsch
 Български
 Français
 Tiếng Việt
 中文
中文 বাংলা
বাংলা हिन्दी
 Čeština
 Українська
 Română

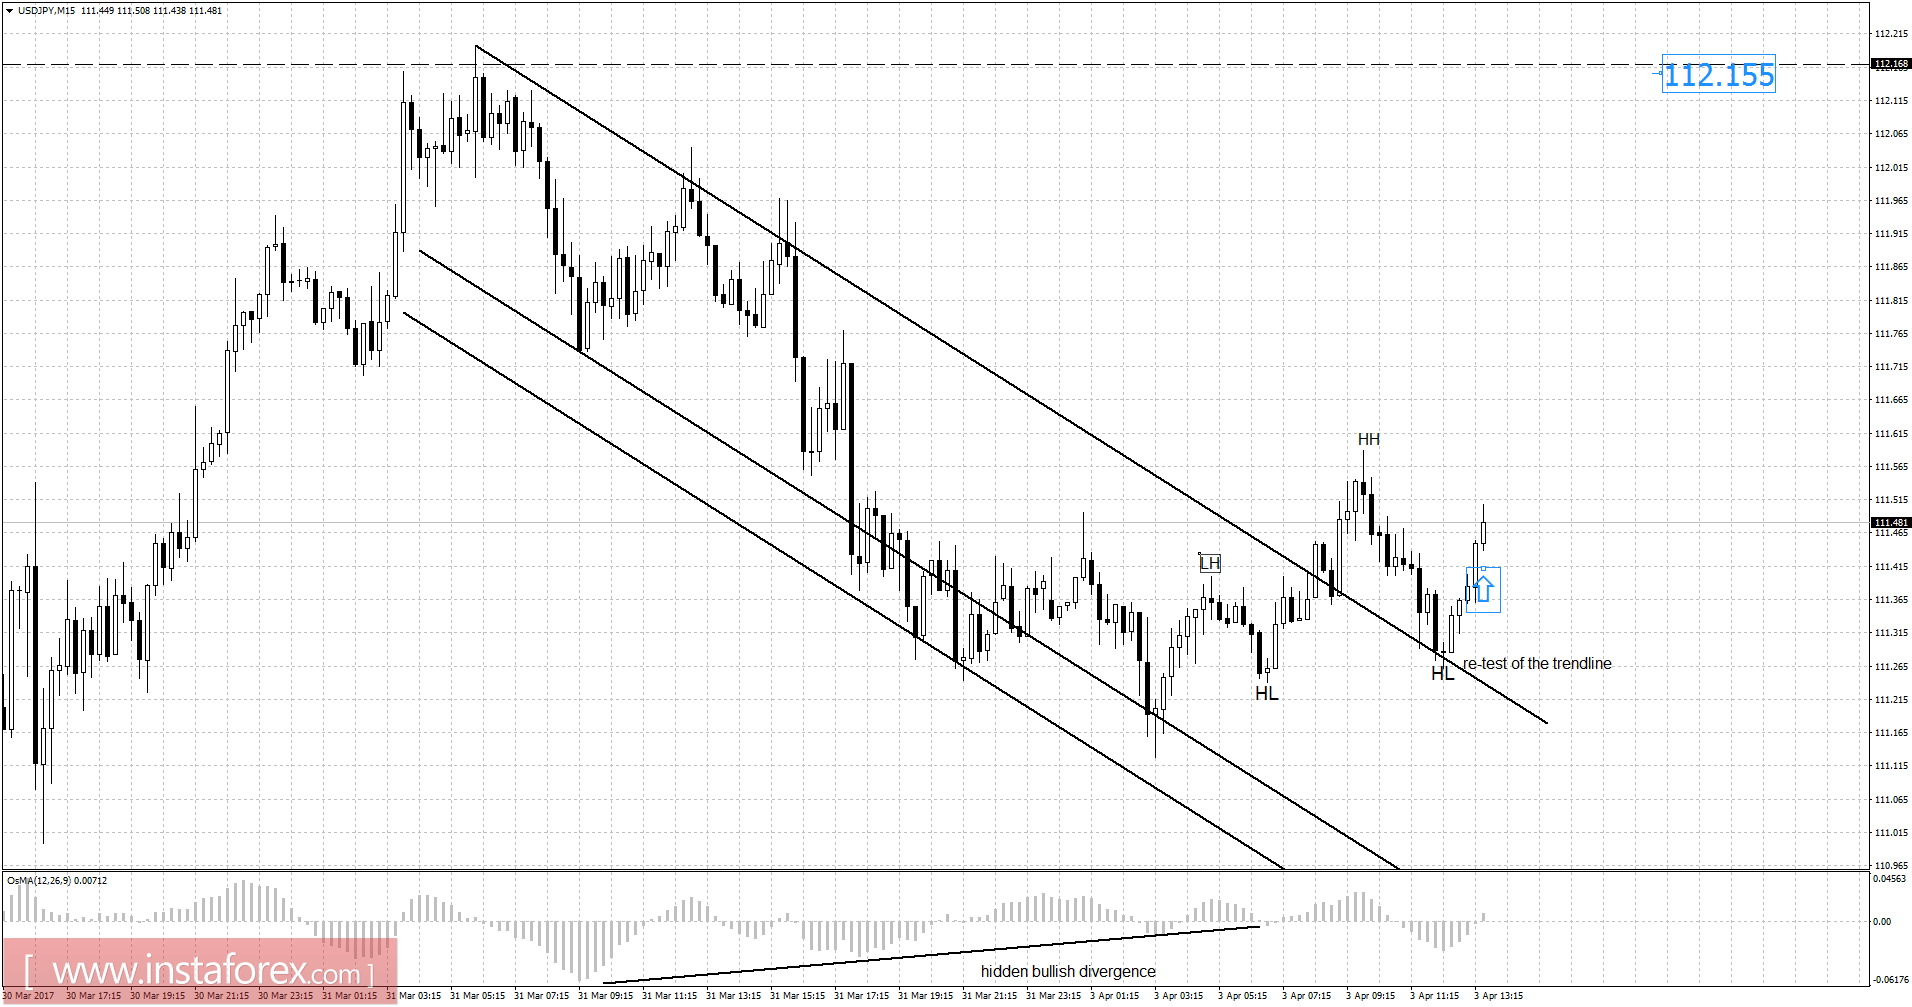
Recently, the USD/JPY pair has been trading sideways at the price of 111.45. On the 15M time frame, I found broken downward channel and successful re-test which is sign that selling looks risky. There is also a strong hidden bullish divergence in the background which is another sign of potetnial strength. My advice is to watch for potential buying opportunities. The first target is set at the price of 112.15.
Resistance levels:
R1: 111.45
R2: 111.50
R3: 111.40
Support levels:
S1: 111.22
S2: 111.15
S3: 111.05
Trading recommendations for today: watch for potential buying opportunities.