 English
  Русский
 Bahasa Indonesia
 Bahasa Malay
 ไทย
ไทย Español
 Deutsch
 Български
 Français
 Tiếng Việt
 中文
中文 বাংলা
বাংলা हिन्दी
 Čeština
 Українська
 Română

The pair managed to have a very bearish's weekly opening, as it's challenging the 200 SMA at H1 chart. If that moving average gives up, then we can expect further weakness toward 1.2391, where a downside acceleration can increase. Overall, GBP/USD seems to have found dynamic support over 1.2450 and if it breaks above 1.2512, then it can reach the 1.2570 level.
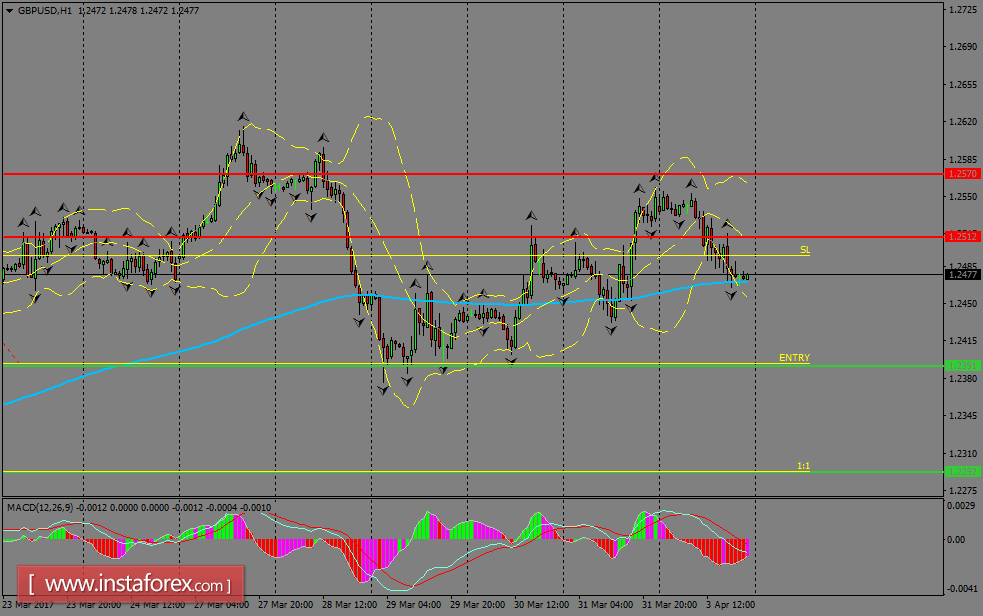
H1 chart's resistance levels: 1.2512 / 1.2570
H1 chart's support levels: 1.2391 / 1.2292
Trading recommendations for today: Based on the H1 chart, sell (short) orders only if the GBP/USD pair breaks a bearish candlestick; the support level is at 1.2391, take profit is at 1.2292 and stop loss is at 1.2493.