 English
  Русский
 Bahasa Indonesia
 Bahasa Malay
 ไทย
ไทย Español
 Deutsch
 Български
 Français
 Tiếng Việt
 中文
中文 বাংলা
বাংলা हिन्दी
 Čeština
 Українська
 Română

Gold has broken out and above the short-term bearish channel as expected and is challenging the $1,263 top. A break above that top is expected as well as a move towards $1,300. Trend is now bullish and important short-term support is found at $1,240.
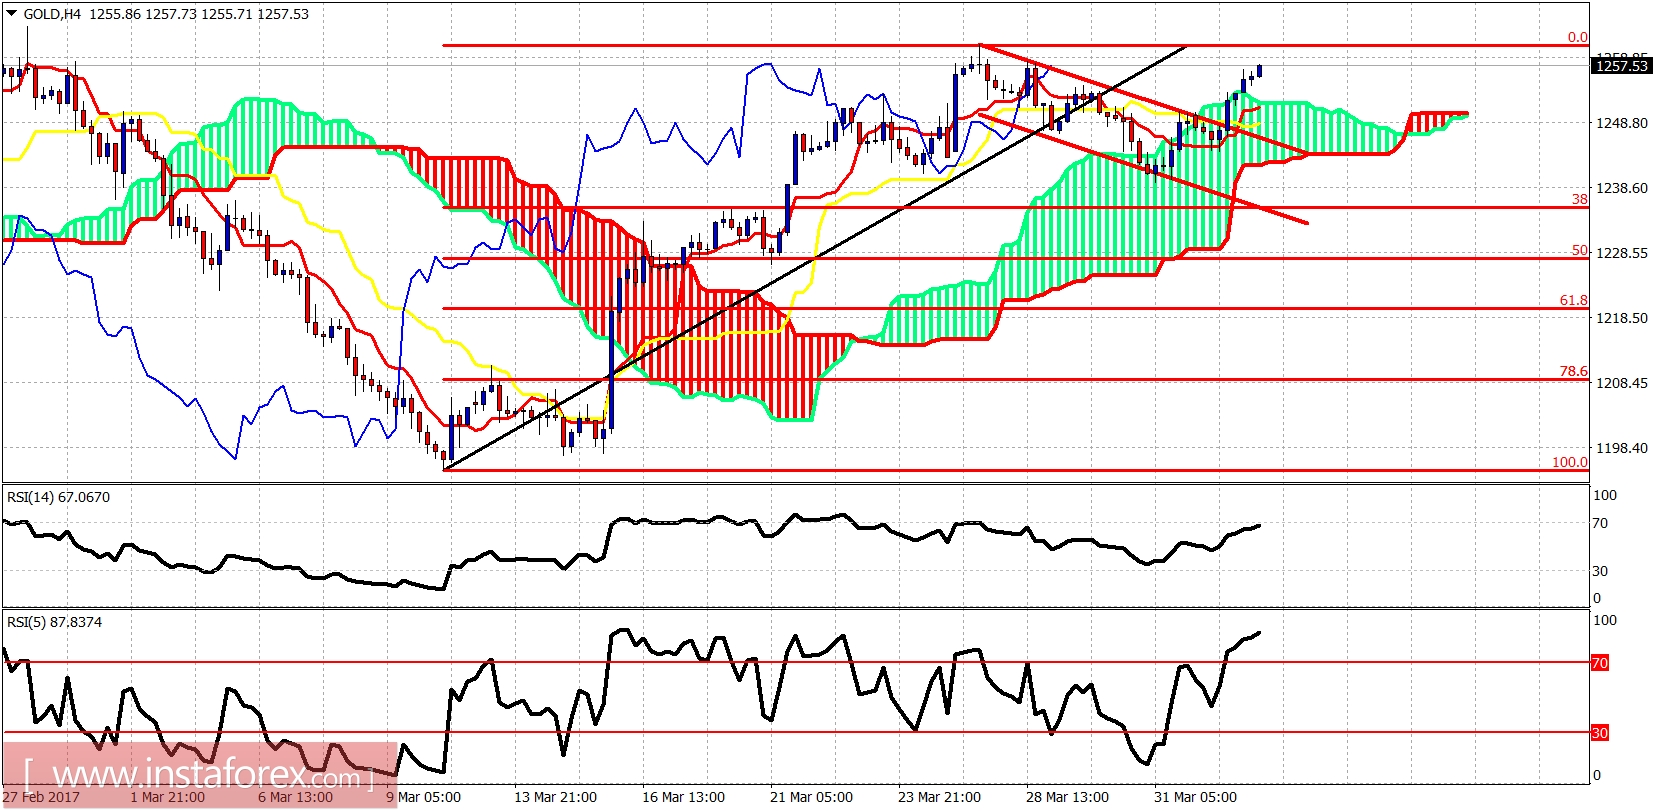
Gold has moved above the 4-hour Kumo (cloud) and is breaking higher. Trend is bullish. A back test of the broken cloud could be seen today but overall trend remains bullish and we continue to target $1,300-$1,310.
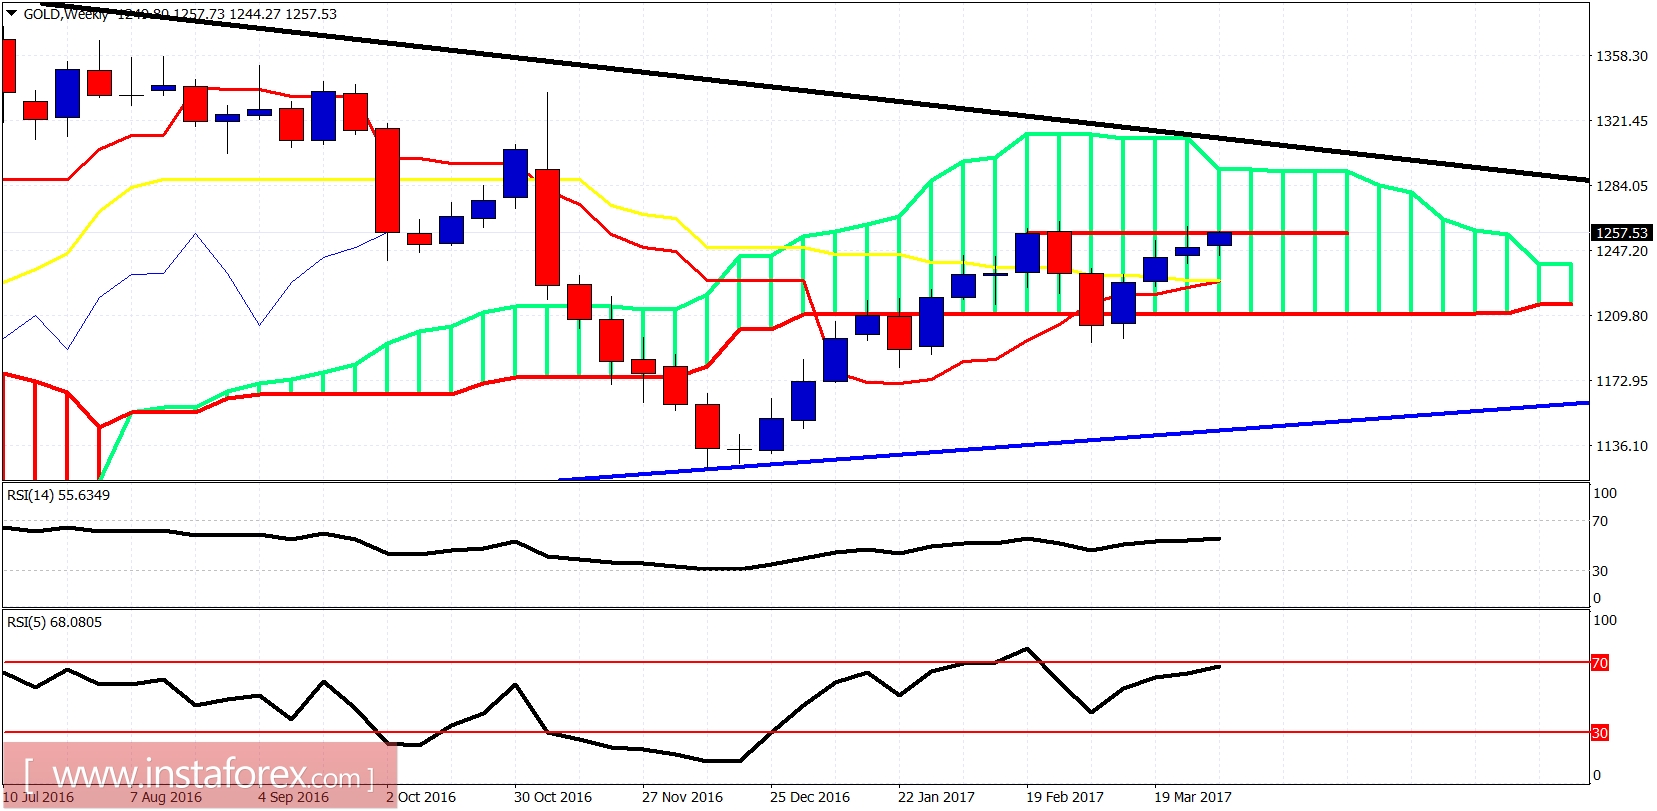
Black line - long-term resistance
Blue line - long-term support
The weekly candle is about to break above the resistance of the 2017 highs. Once broken, I expect Gold price to move towards the black trend line resistance around $1,300. I continue to be optimistic as long as the price remains above $1,194.