 English
  Русский
 Bahasa Indonesia
 Bahasa Malay
 ไทย
ไทย Español
 Deutsch
 Български
 Français
 Tiếng Việt
 中文
中文 বাংলা
বাংলা हिन्दी
 Čeština
 Українська
 Română

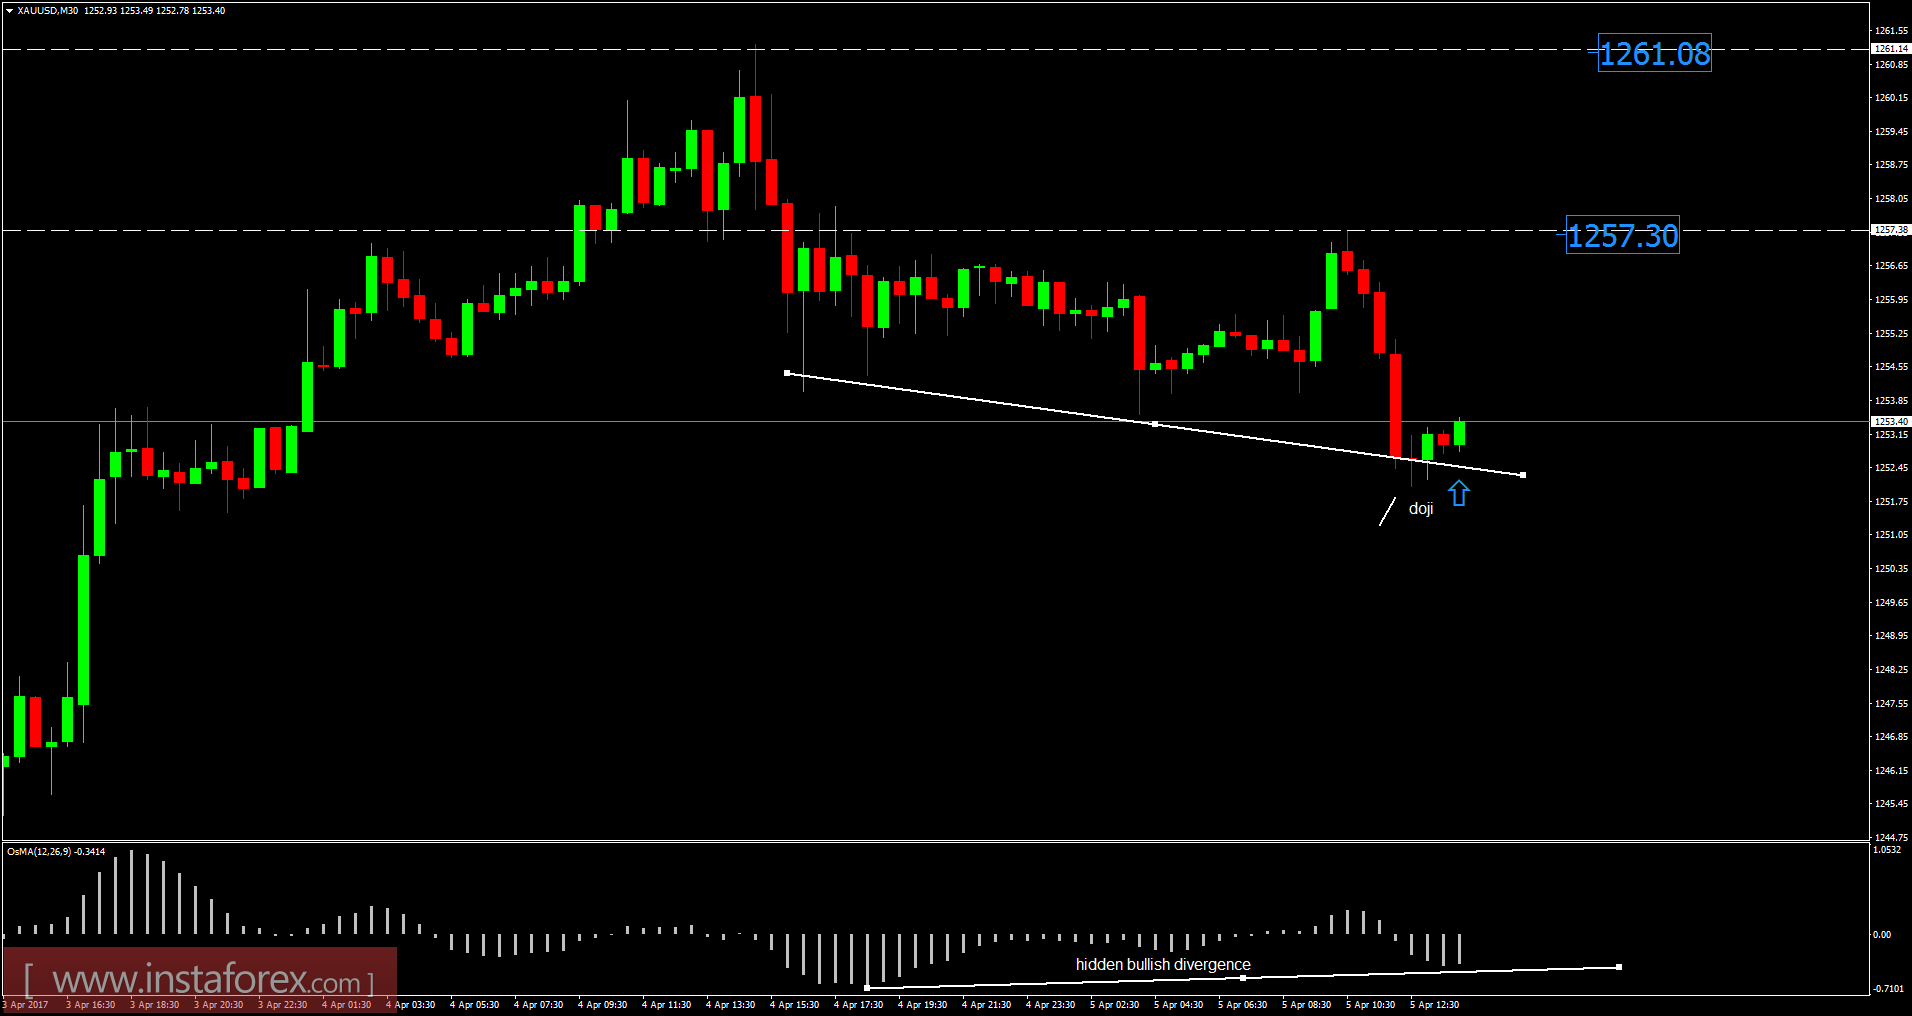
Recently, the Gold has been trading downward. The price tested the level of $1,252.00. Anyway, according to the 30M time frame, I have found hidden bullish divergence on the moving average oscillator, which is a sign that selling looks risky. Also, there is a doji candle in the background, which is another sign that sellers lost power and that buyers may build their positions. My advice is to watch for potential intraday buying opportunities. The upward targets are set at the price of $1,257.00 and $1,261.00. Anyway, if the price breaks the level of $1,252.00, the Gold my visit level of $1,244.50.
Resistance levels:
R1: $1,262.00
R2: $1,264.35
R3: $1,267.50
Support levels:
S1: $1,256.00
S2: $1,254.00
S3: $1,251.00
Trading recommendations for today: watch for potential intraday buying opportunities.