 English
  Русский
 Bahasa Indonesia
 Bahasa Malay
 ไทย
ไทย Español
 Deutsch
 Български
 Français
 Tiếng Việt
 中文
中文 বাংলা
বাংলা हिन्दी
 Čeština
 Українська
 Română

Gold price back tested the cloud support as we expected and bounced back towards its recent highs and important medium-term resistance. The bulls need to break above $1,263 and hold $1,240. I remain bullish looking for a breakout towards $1,280-$1,300 first.
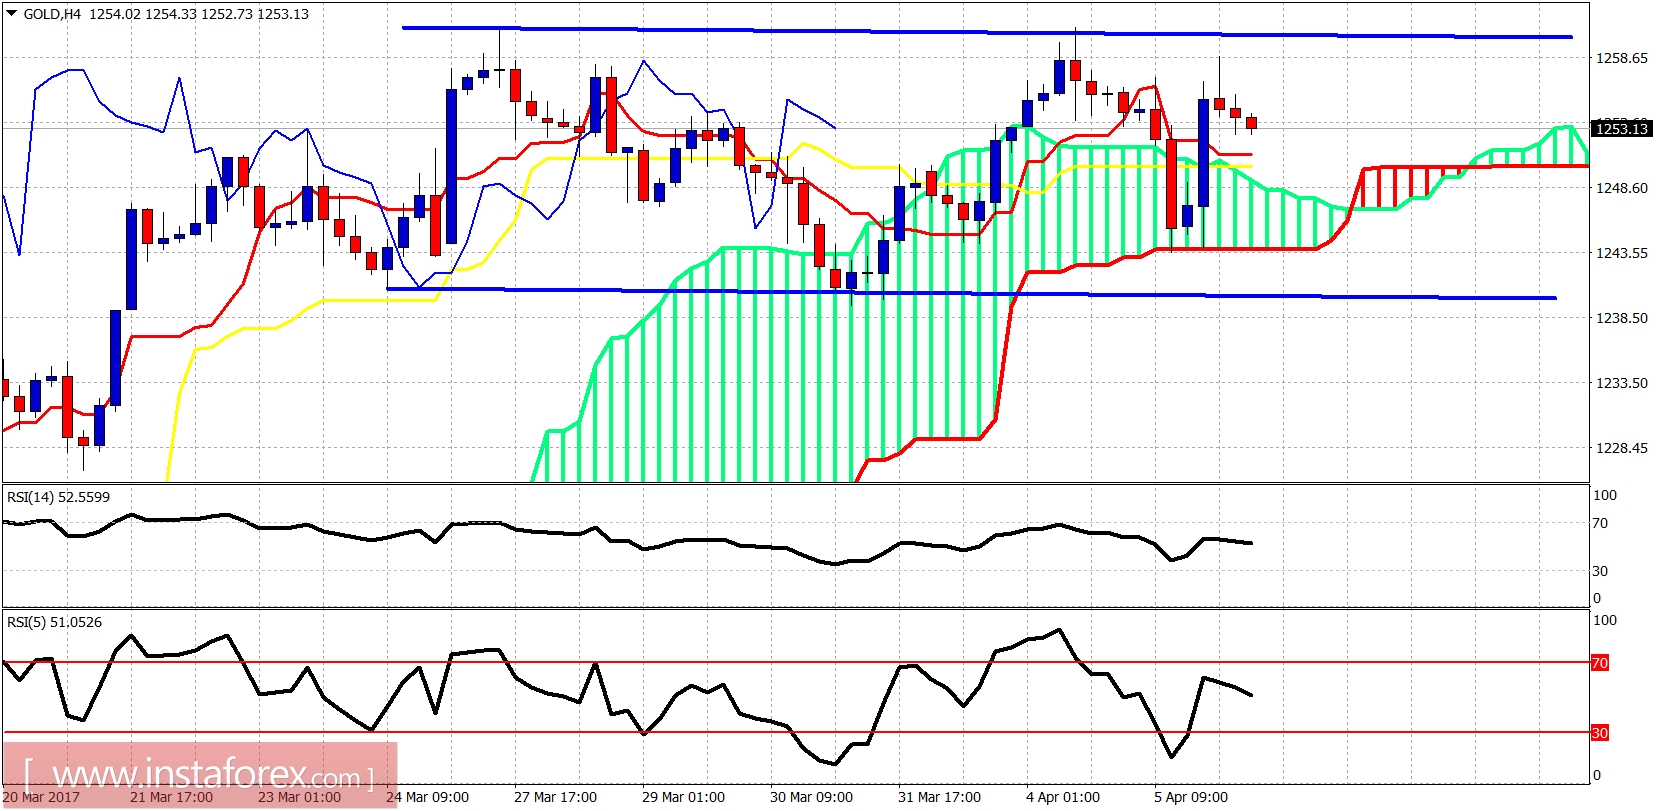
Gold is trading above the 4-hour Ichimoku cloud. Trend is bullish. The price bounced off the lower cloud boundary and now we wait for the breakout. Gold should now break resistance at $1,263. The more it delays it, the chances for a deeper pullback increase. Critical short-term support is at $1,240.
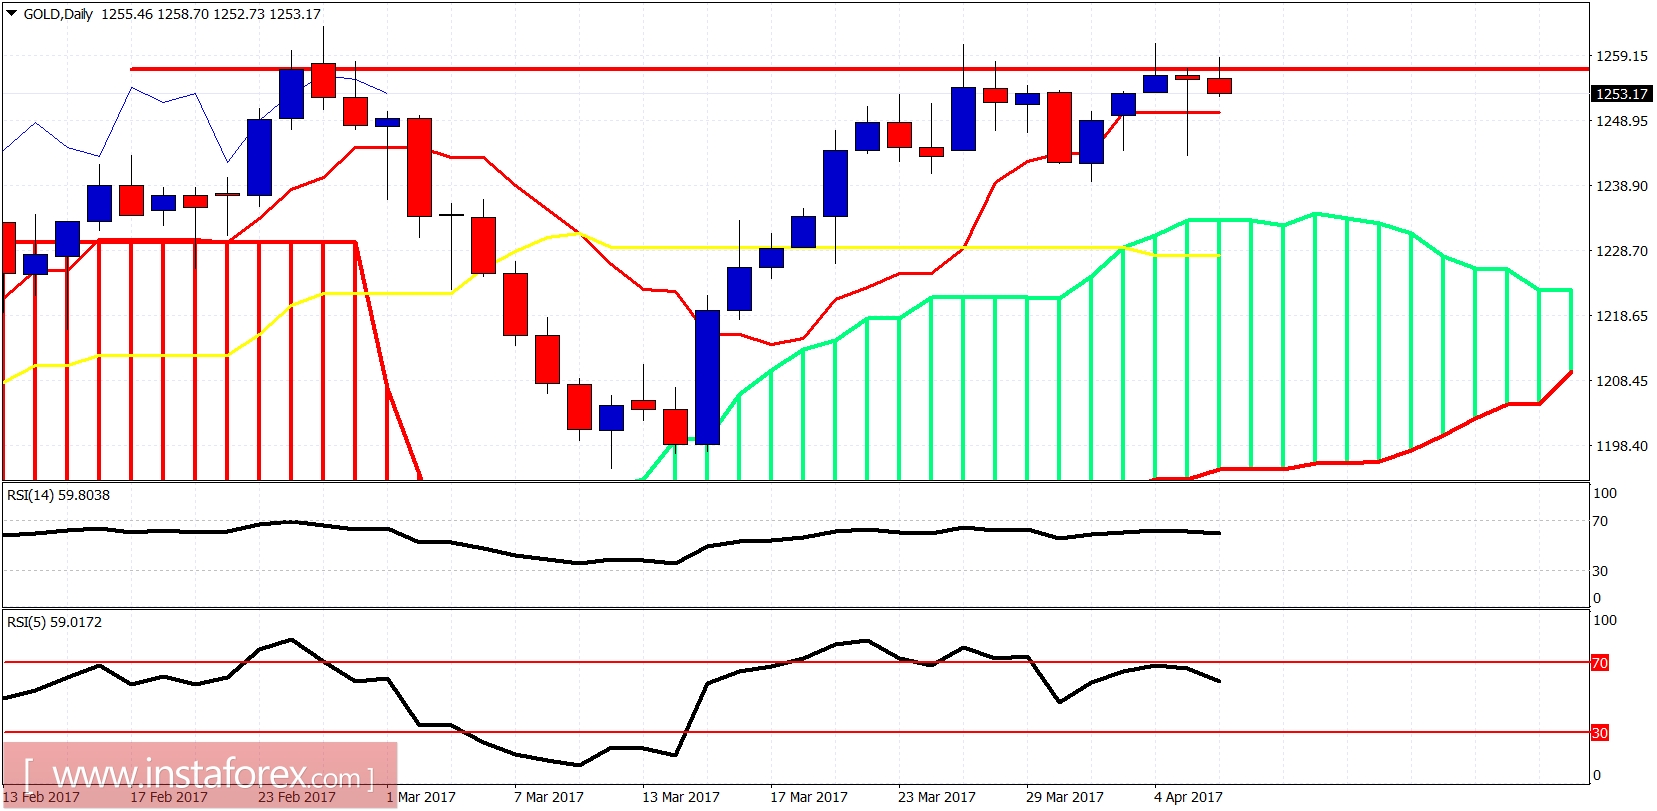
Yesterday's daily candle is very impressive as buyers stepped in and erased the losses and pushed Gold price back to its highs. However, we still have no breakout. I remain optimistic looking for a breakout soon.