 English
  Русский
 Bahasa Indonesia
 Bahasa Malay
 ไทย
ไทย Español
 Deutsch
 Български
 Français
 Tiếng Việt
 中文
中文 বাংলা
বাংলা हिन्दी
 Čeština
 Українська
 Română

Gold broke to new highs above the 2017 highs earlier tonight after the attack in Syria by the US army forces. We should expect a pullback or a back test of the broken resistance level at $1,257-60. In the long term I remain bullish looking for $1,300-$1,310.
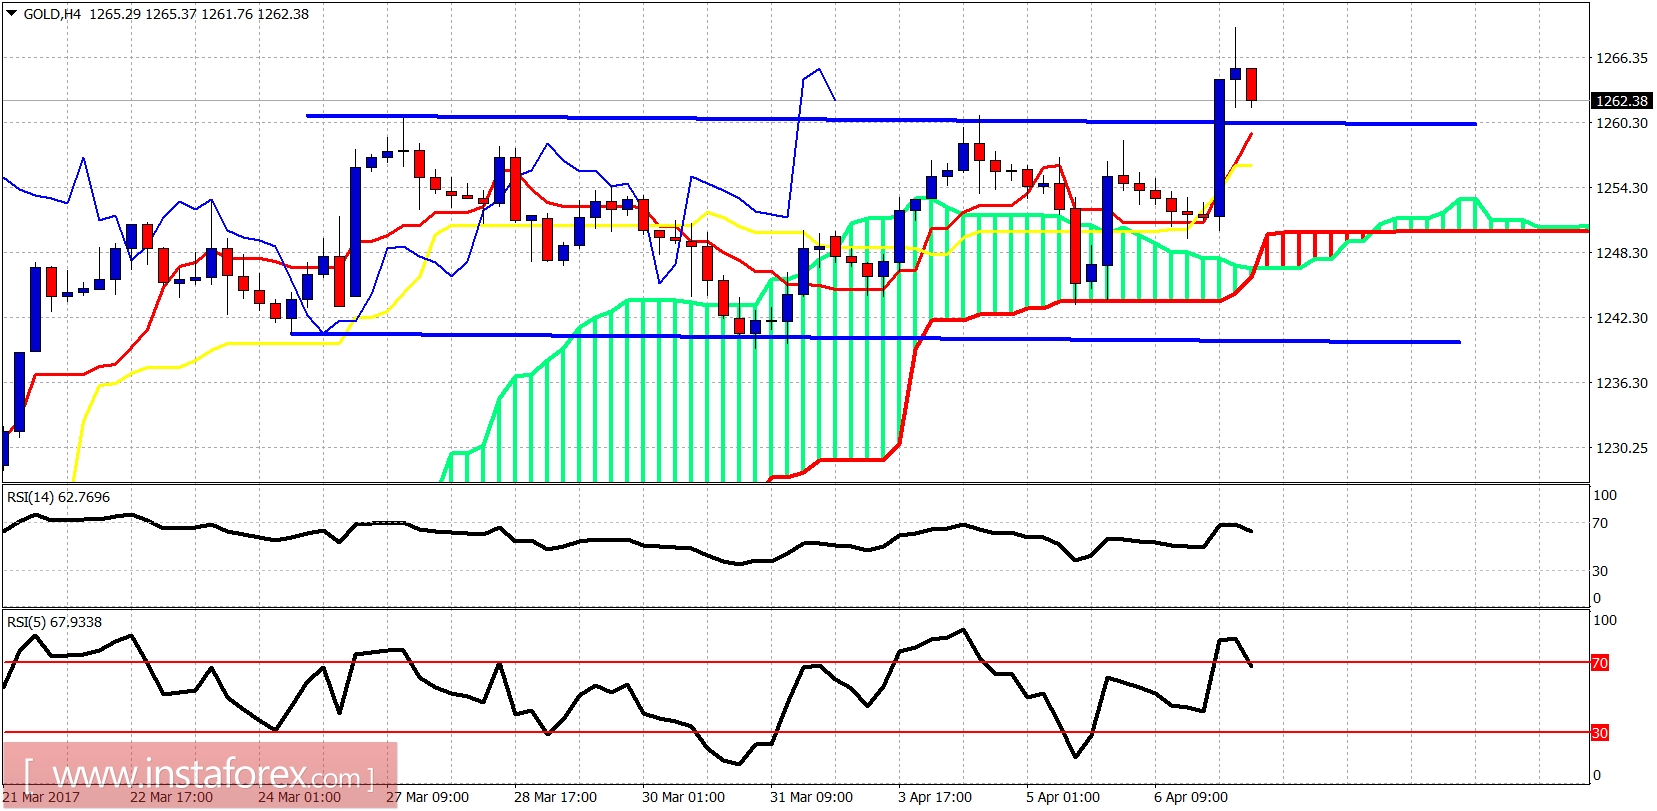
The price broke out of the trading range. It is above the Kumo (cloud). Trend is bullish in the 4-hour chart. Both tenkan- and kijun-sen are pointing higher. I expect more upside in price action. Support is at $1,257-60. Resistance is now at $1,280.
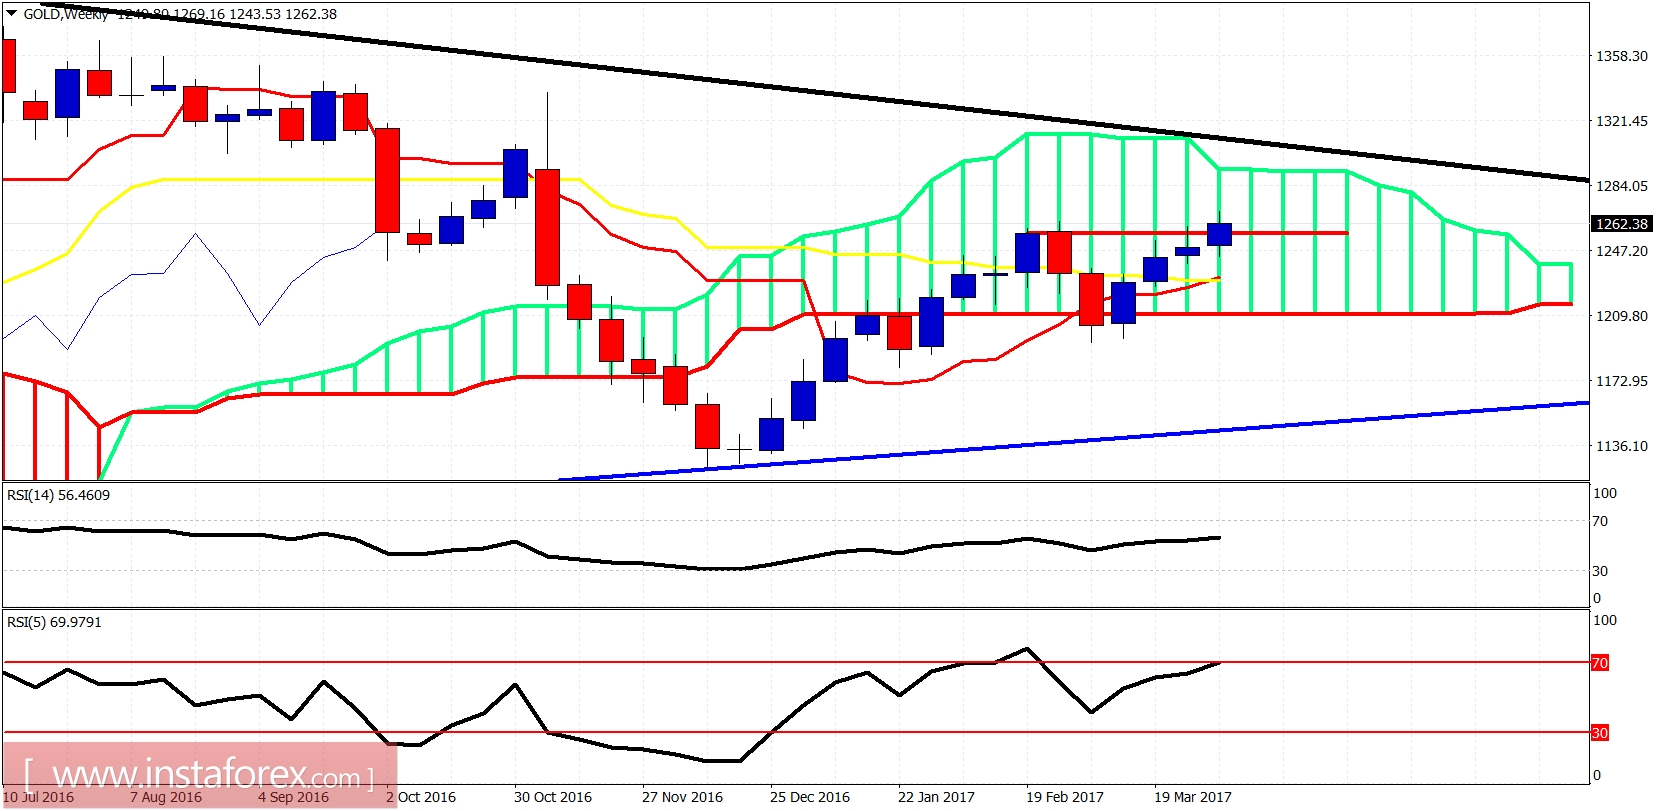
Black line - long-term resistance
Blue line - long-term support
Gold weekly candle is breaking above the short-term resistance and 2017 highs. The weekly close will be important. A weekly close above $1,263 will open the way for a push at least towards $1,285-$1,310. Trend is bullish. There are no divergence signs.