 English
  Русский
 Bahasa Indonesia
 Bahasa Malay
 ไทย
ไทย Español
 Deutsch
 Български
 Français
 Tiếng Việt
 中文
中文 বাংলা
বাংলা हिन्दी
 Čeština
 Українська
 Română

The pair plummeted during Friday and now it's heading towards 1.2333, as the Cable is trying to break the range where the price action has been moving on. If GBP/USD manages to break the next target at the 1.2333 level, then it can test the 1.2292 zone. MACD indicator is turning flat, calling for more sideways in coming days.
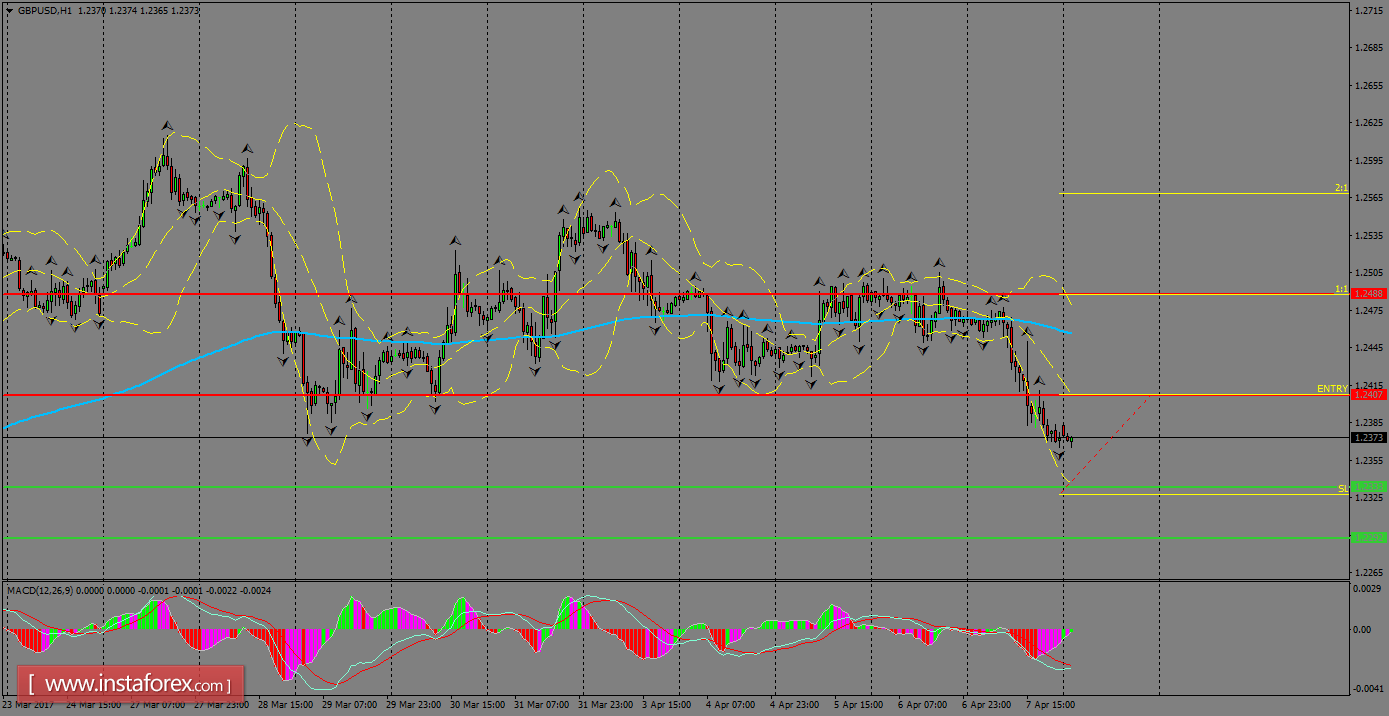
H1 chart's resistance levels: 1.2407 / 1.2488
H1 chart's support levels: 1.2333 / 1.2292
Trading recommendations for today: Based on the H1 chart, buy (long) orders only if the GBP/USD pair breaks a bullish candlestick; the resistance level is at 1.2407, take profit is at 1.2488 and stop loss is at 1.2327.