 English
  Русский
 Bahasa Indonesia
 Bahasa Malay
 ไทย
ไทย Español
 Deutsch
 Български
 Français
 Tiếng Việt
 中文
中文 বাংলা
বাংলা हिन्दी
 Čeština
 Українська
 Română

Despite the bearish divergence signs and the resistance at the 61.8% Fibonacci retracement, the Dollar index managed to fight the worse-than-expected NFP figures announced on Friday and pushed higher towards 101.50 where the next resistance is found.
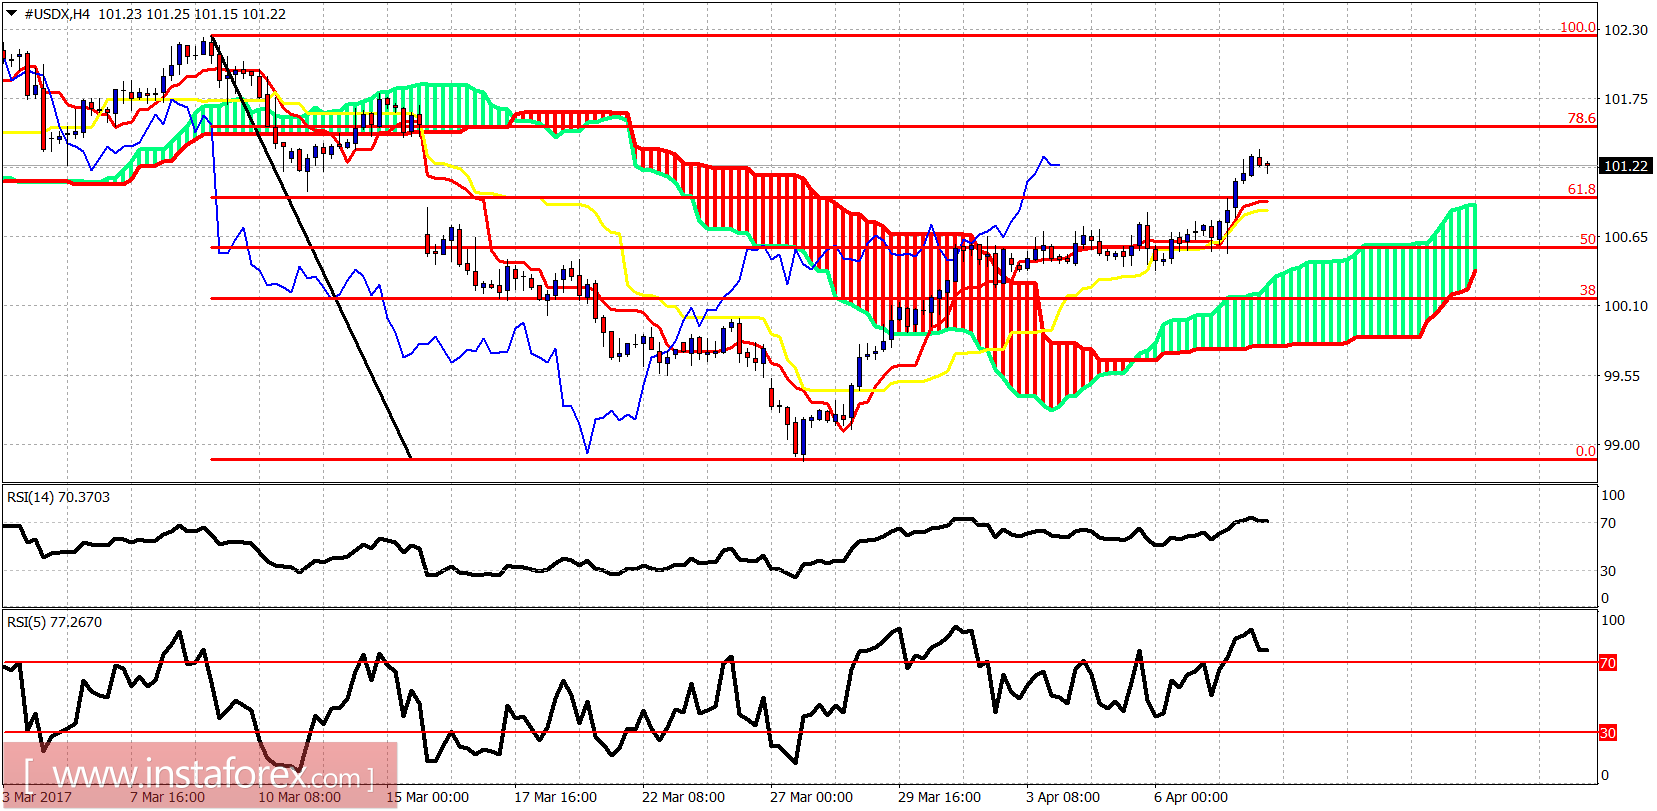
Price is trading above the Ichimoku cloud and both the tenkan- and kijun-sen indicators. Trend is bullish. Oscillators are overbought. Resistance is now at 101.50 where the 78.6% Fibonacci retracement is found. Support is at 100.90.
Black line -support
Green line - long-term support trend line
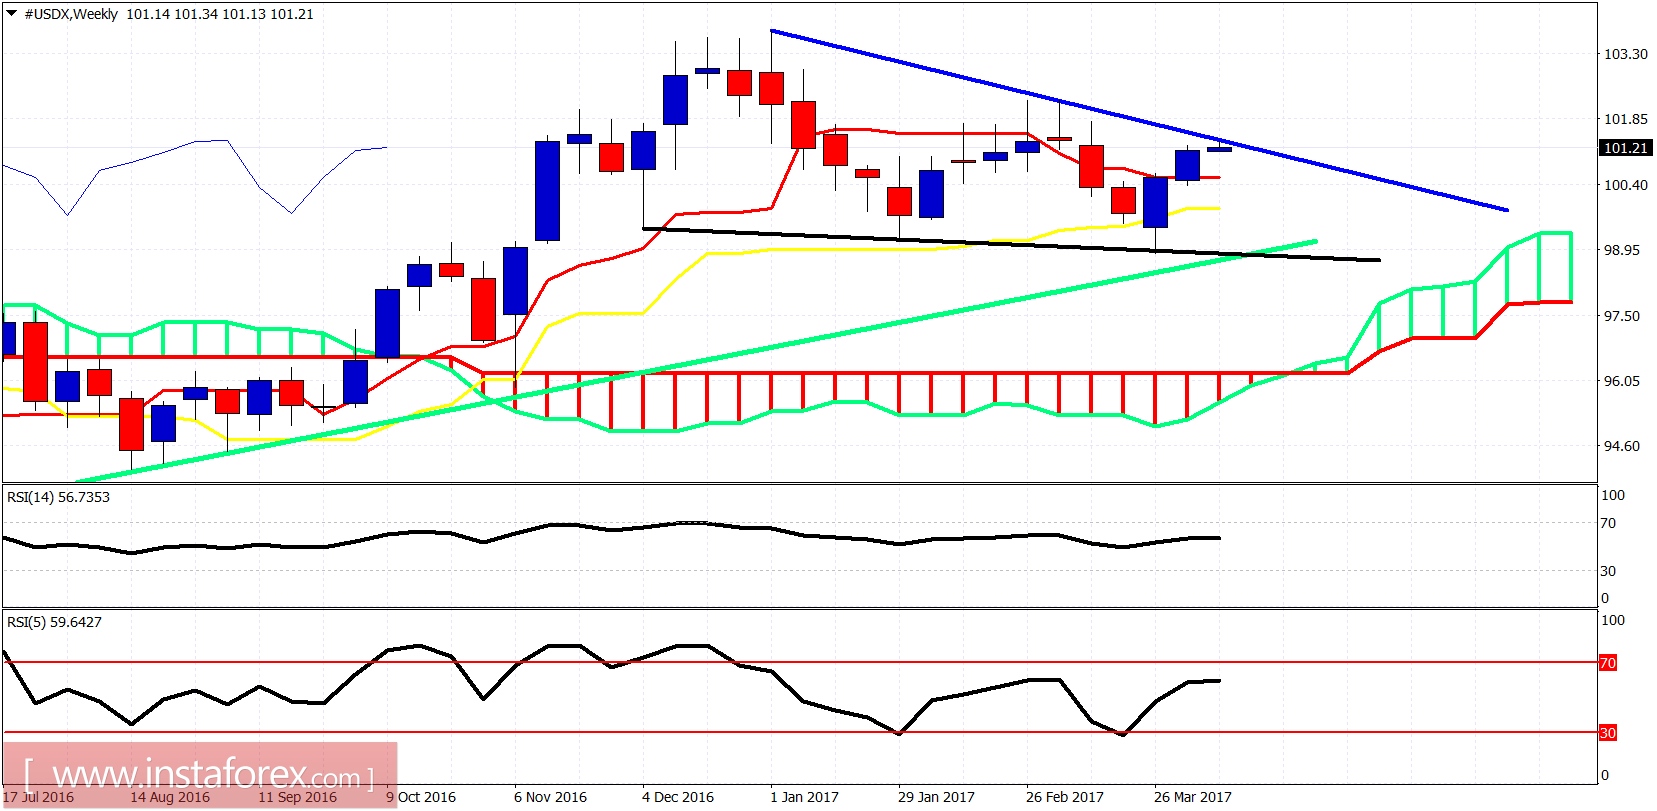
On the weekly chart, price is testing important weekly trend line resistance at 101.20-101.50 area. I expect this trend line is not to be broken and price to get rejected this or next week from the 101.50 level. I will focus on the bearish side of the trade as long as price is below the blue trend line and especially below 102.30.