 English
  Русский
 Bahasa Indonesia
 Bahasa Malay
 ไทย
ไทย Español
 Deutsch
 Български
 Français
 Tiếng Việt
 中文
中文 বাংলা
বাংলা हिन्दी
 Čeština
 Українська
 Română

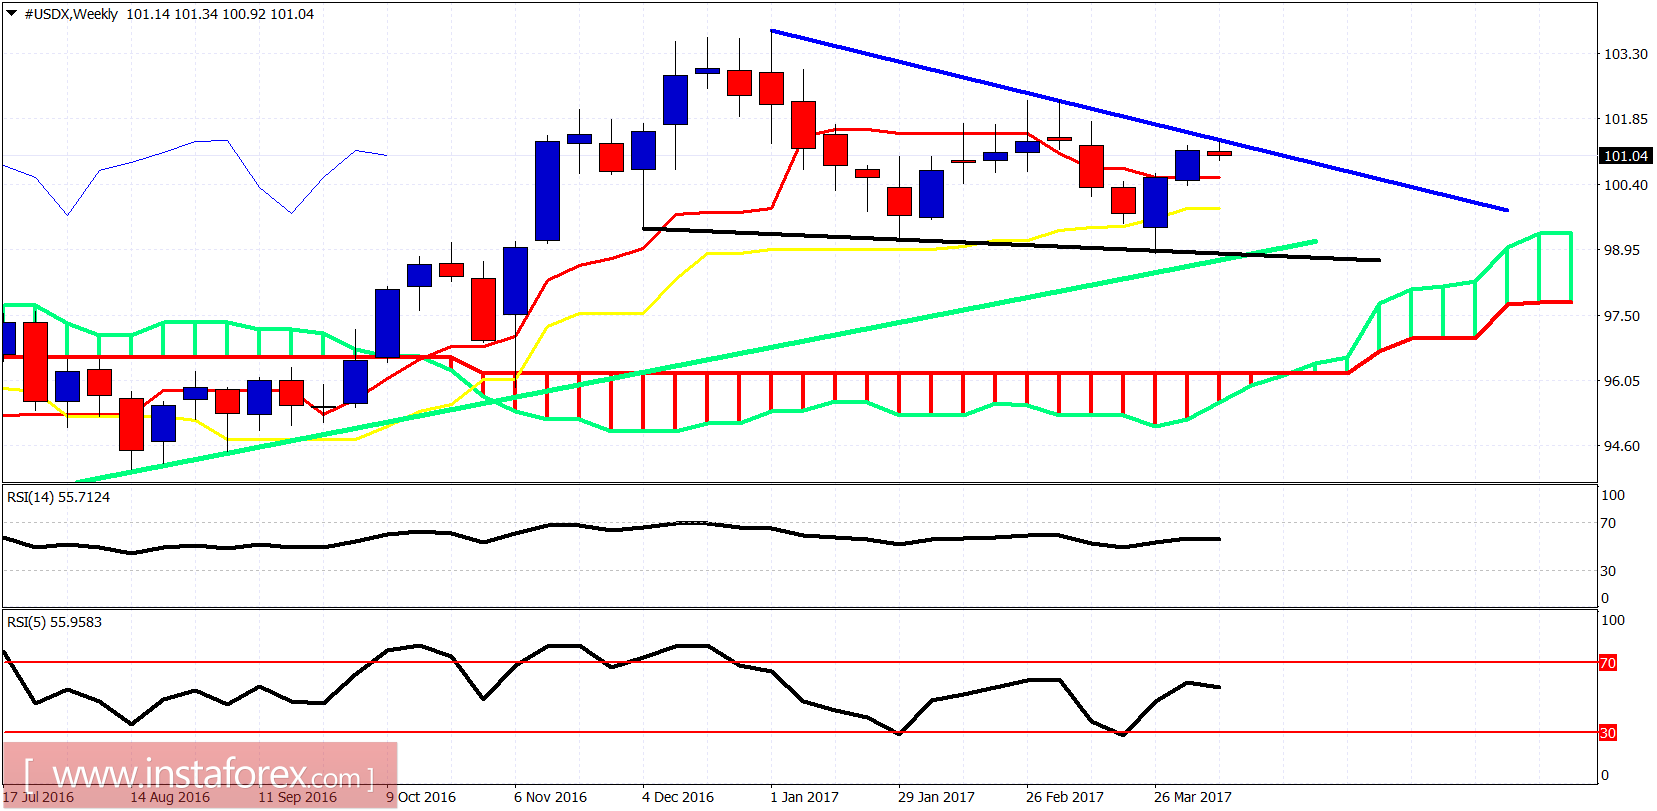
As expected the Dollar index is showing reversal signs off the critical weekly resistance at 101.50. Price managed to reach 101.35 yesterday. I believe this is not the right time to buy Dollar.
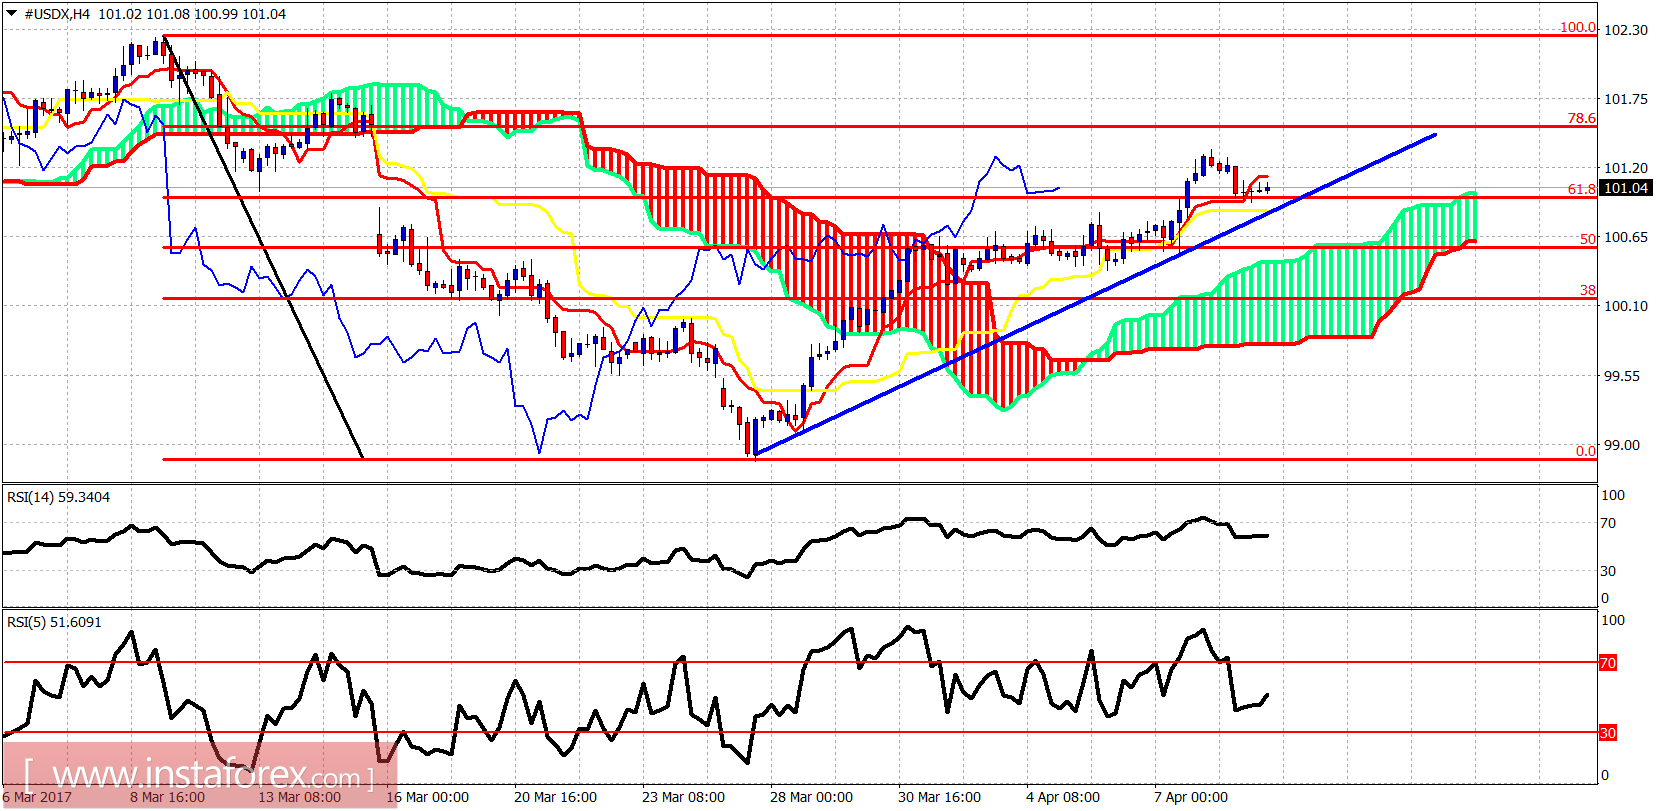
The Dollar index remains in a short-term bullish trend. Price is above the Ichimoku cloud on the 4-hour chart. Short-term support is at 100.83 by the blue trend line. Price almost reached the 78.6% Fibonacci retracement and is reversing.
Blue line - resistance
Black line - support
Green line - trend line support
The Dollar index reached the blue trend line resistance and is showing rejection signs. This is important resistance area and unless we break above 101.50, bulls should be very careful as I expect price to turn back down at least towards the black trend line suppport.