 English
  Русский
 Bahasa Indonesia
 Bahasa Malay
 ไทย
ไทย Español
 Deutsch
 Български
 Français
 Tiếng Việt
 中文
中文 বাংলা
বাংলা हिन्दी
 Čeština
 Українська
 Română

The pair had a strong rally during Tuesday's session, as the GBP currency strengthened across the board against its major rivals. However, such move wasn't decisive at all, as GBP/USD is still looking for a clear path in the mid-term. The narrow range between the 1.2600 and 1.2300 handles remains in place and while the pair continues to move inside that area, we can't expect significative moves.
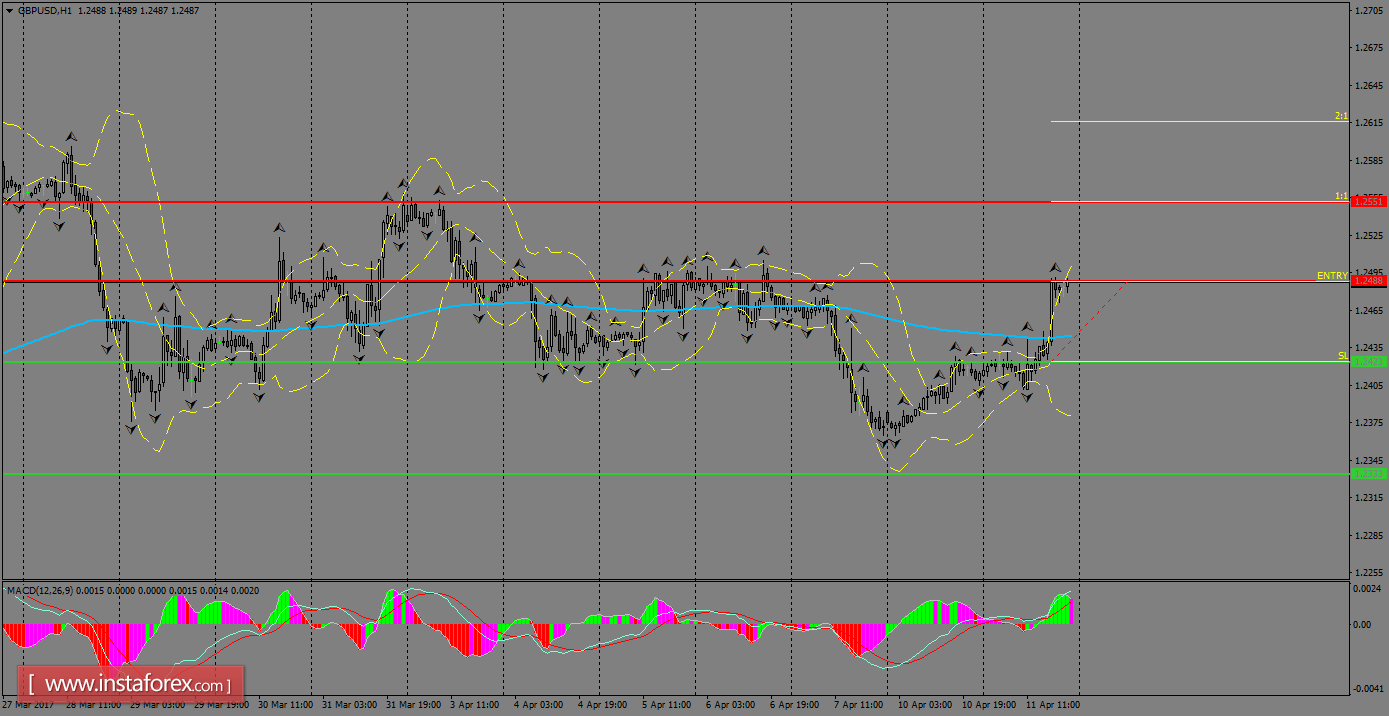
H1 chart's resistance levels: 1.2488 / 1.2551
H1 chart's support levels: 1.2423 / 1.2333
Trading recommendations for today: Based on the H1 chart, buy (long) orders only if the GBP/USD pair breaks a bullish candlestick; the resistance level is at 1.2488, take profit is at 1.2551 and stop loss is at 1.2424.