 English
  Русский
 Bahasa Indonesia
 Bahasa Malay
 ไทย
ไทย Español
 Deutsch
 Български
 Français
 Tiếng Việt
 中文
中文 বাংলা
বাংলা हिन्दी
 Čeština
 Українська
 Română

The Dollar index has rejected the weekly resistance as expected and has also broken below the short-term support, pushing the price towards our short-term pullback targets of 100.40. As long as the price is below 101.50, I expect the Dollar index to challenge the March lows once again and most probably break them.
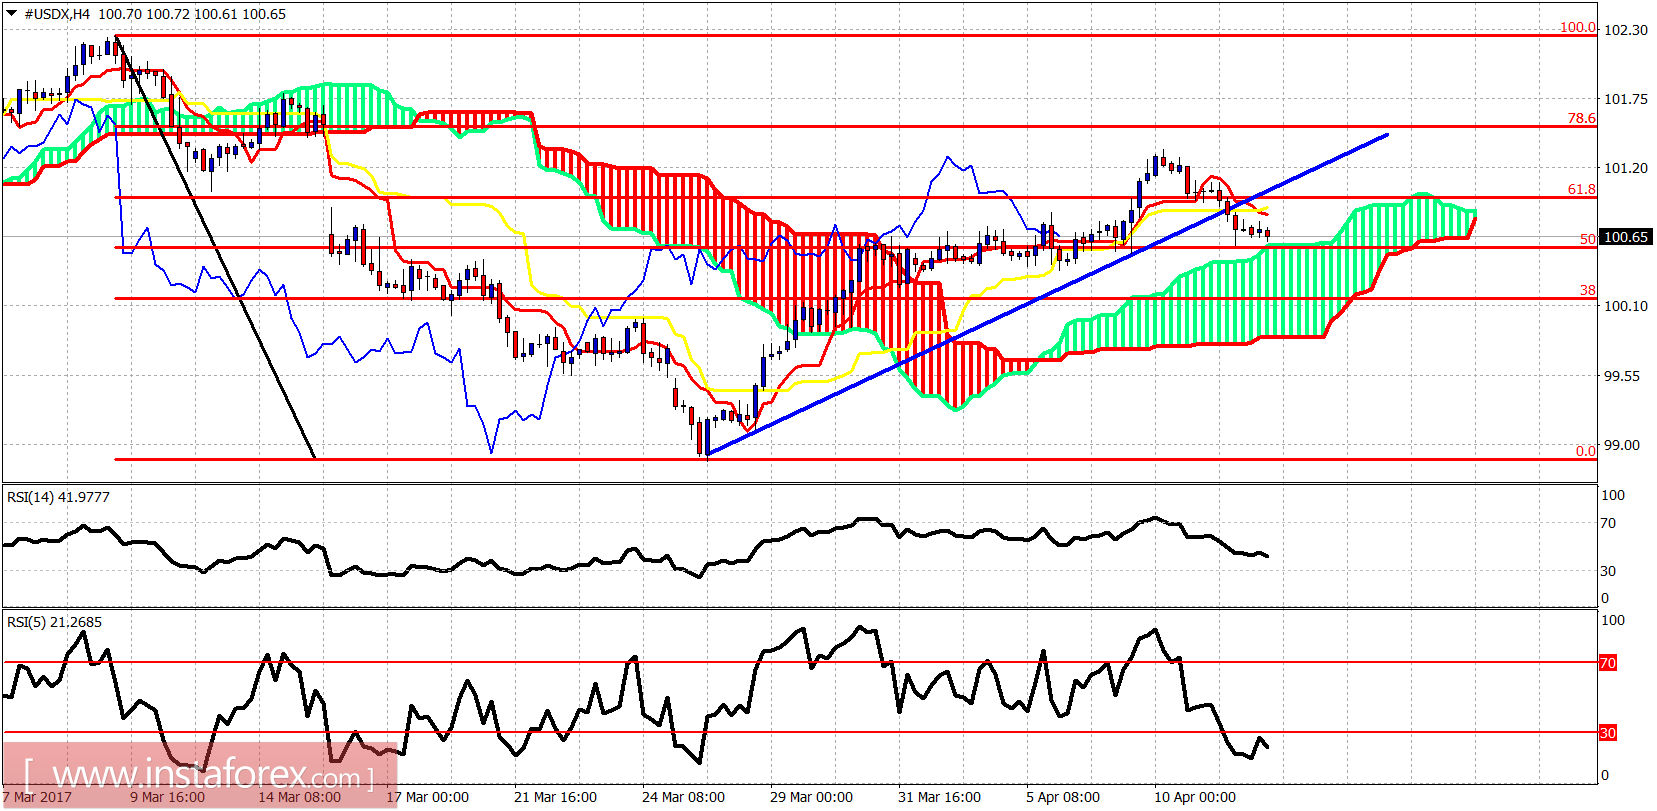
Gold price has reached the 4 hour Ichimoku cloud support at 100.50-100.40. If the price holds above the cloud, we could see a re-test of recent highs at 101.30 and possibly a break to new highs at 101.50 where the weekly resistance is found.
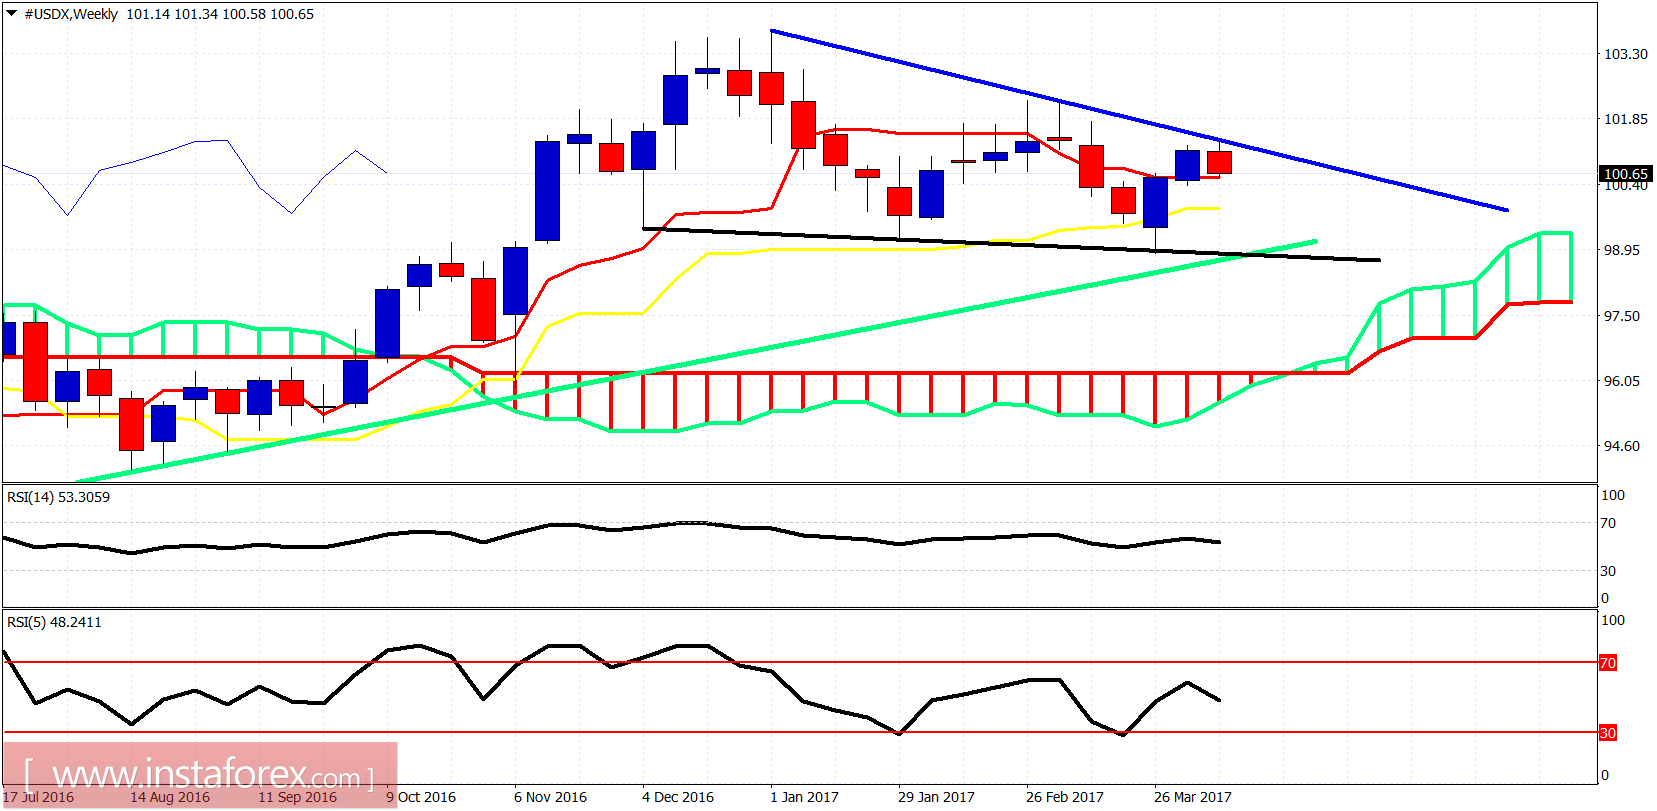
Black line - neckline support
Green line - long-term support trend line
The Dollar index got rejected at the blue trend line resistance and is now testing the tenkan-sen (red line indicator) support. A weekly close below 100.45 will be a bearish sign for the next week, opening the way at least towards the weekly kijun-sen (yellow line indicator) at 99.90. A break above 101.50 will be a bullish sign. A break above 102.30 will confirm longer-term bullish trend towards 110.