 English
  Русский
 Bahasa Indonesia
 Bahasa Malay
 ไทย
ไทย Español
 Deutsch
 Български
 Français
 Tiếng Việt
 中文
中文 বাংলা
বাংলা हिन्दी
 Čeština
 Українська
 Română

GBP/USD was favored by the US Dollar's weakness during yesterday's session after Trump's comments about the greenback is getting "too strong". Currently, the pair is heading toward the 1.2551 zone, where a breakout can expose the 1.2658 area, while a pullback should be taken as corrective and Cable can test the support zone of 1.2423.
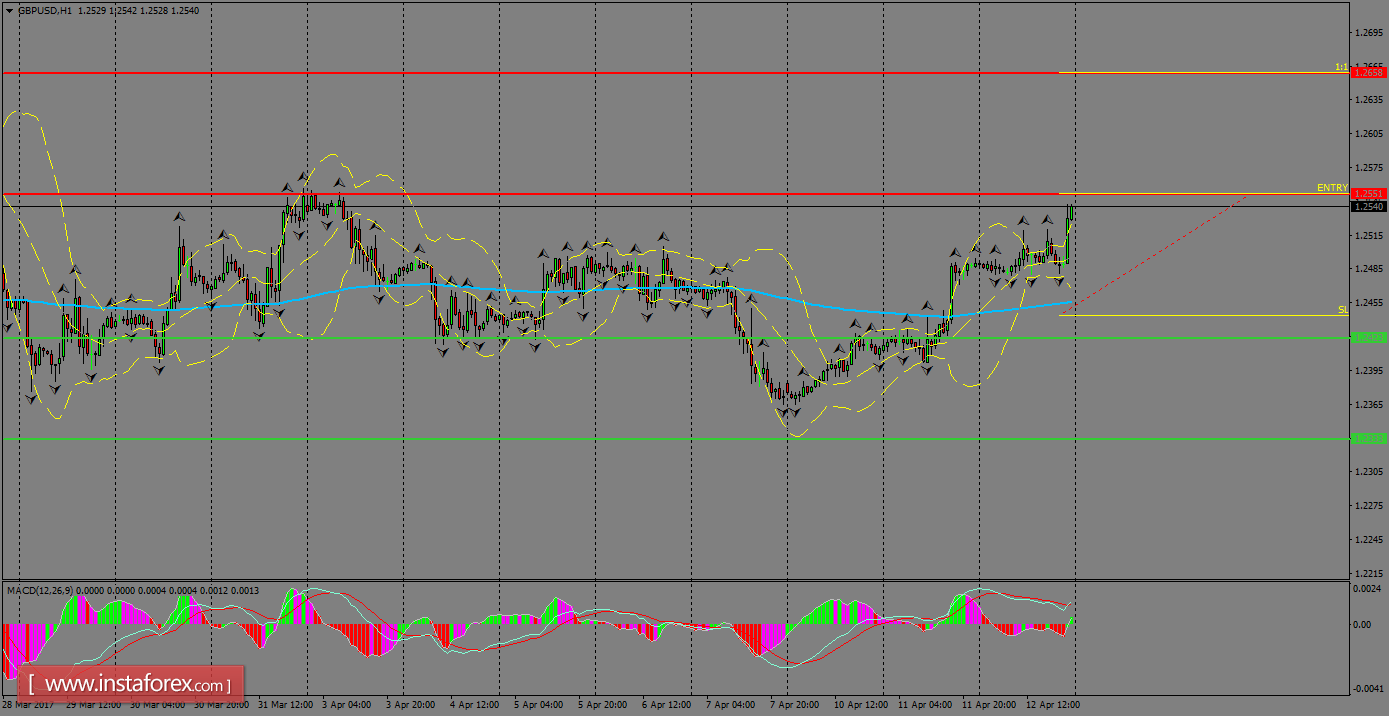
H1 chart's resistance levels: 1.2551 / 1.2658
H1 chart's support levels: 1.2423 / 1.2333
Trading recommendations for today: Based on the H1 chart, buy (long) orders only if the GBP/USD pair breaks a bullish candlestick; the resistance level is at 1.2551, take profit is at 1.2658 and stop loss is at 1.2443.