 English
  Русский
 Bahasa Indonesia
 Bahasa Malay
 ไทย
ไทย Español
 Deutsch
 Български
 Français
 Tiếng Việt
 中文
中文 বাংলা
বাংলা हिन्दी
 Čeština
 Українська
 Română

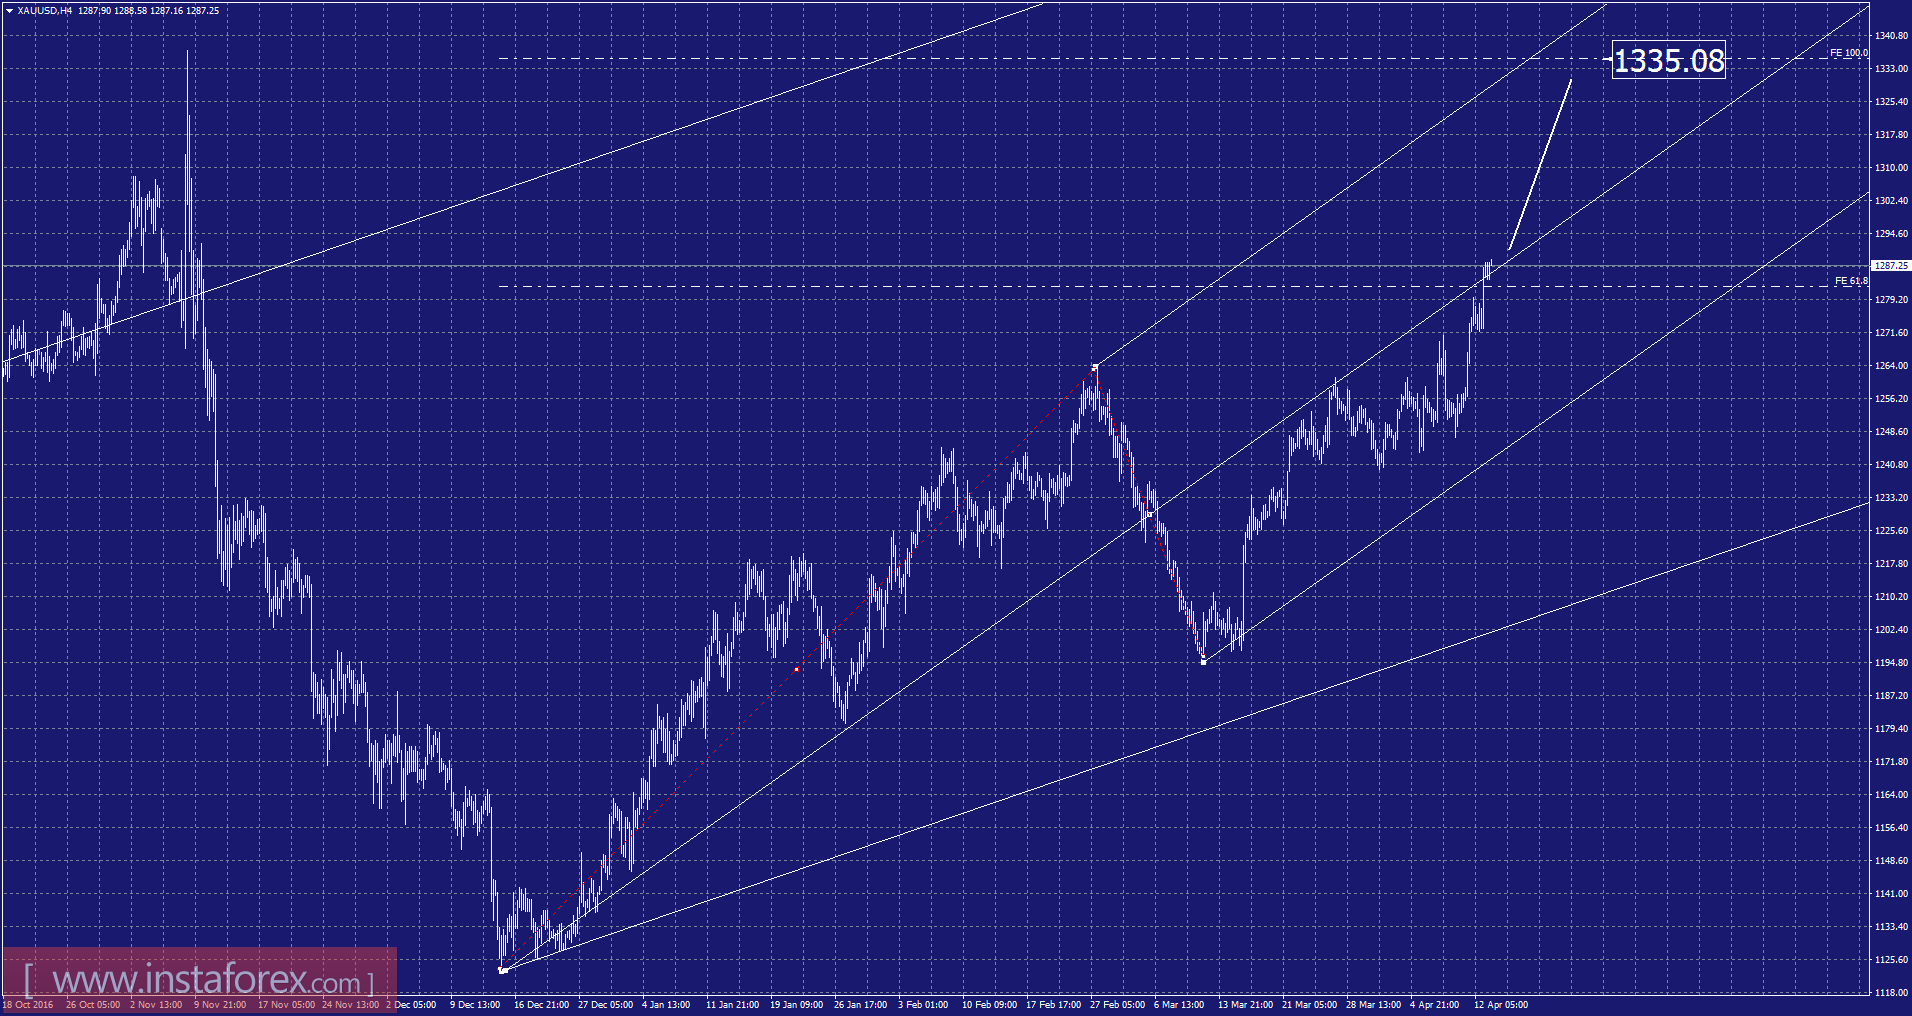
Recently, the Gold has been trading upwards. The price tested the level of $1,288.58. According to the 4H time frame, I found that price has broken the medium line of the upward channel, which is a sign that Gold may continue upward movement. The first downward target is set at the price of $1,306.00. Anyway,I have placed Fibonacci expansion to find potential short – term target. I got Fibonacci expansion 100% at the price of $1,335. My advice is to watch for potential buying opportunities.
Resistance levels:
R1: $1,289.00
R2: $1,290.00
R3: $1,291.00
Support levels:
S1: $1,286.00
S2: $1,285.00
S3: $1,283.80
Trading recommendations for today: watch for potential buying opportunities.