 English
  Русский
 Bahasa Indonesia
 Bahasa Malay
 ไทย
ไทย Español
 Deutsch
 Български
 Français
 Tiếng Việt
 中文
中文 বাংলা
বাংলা हिन्दी
 Čeština
 Українська
 Română

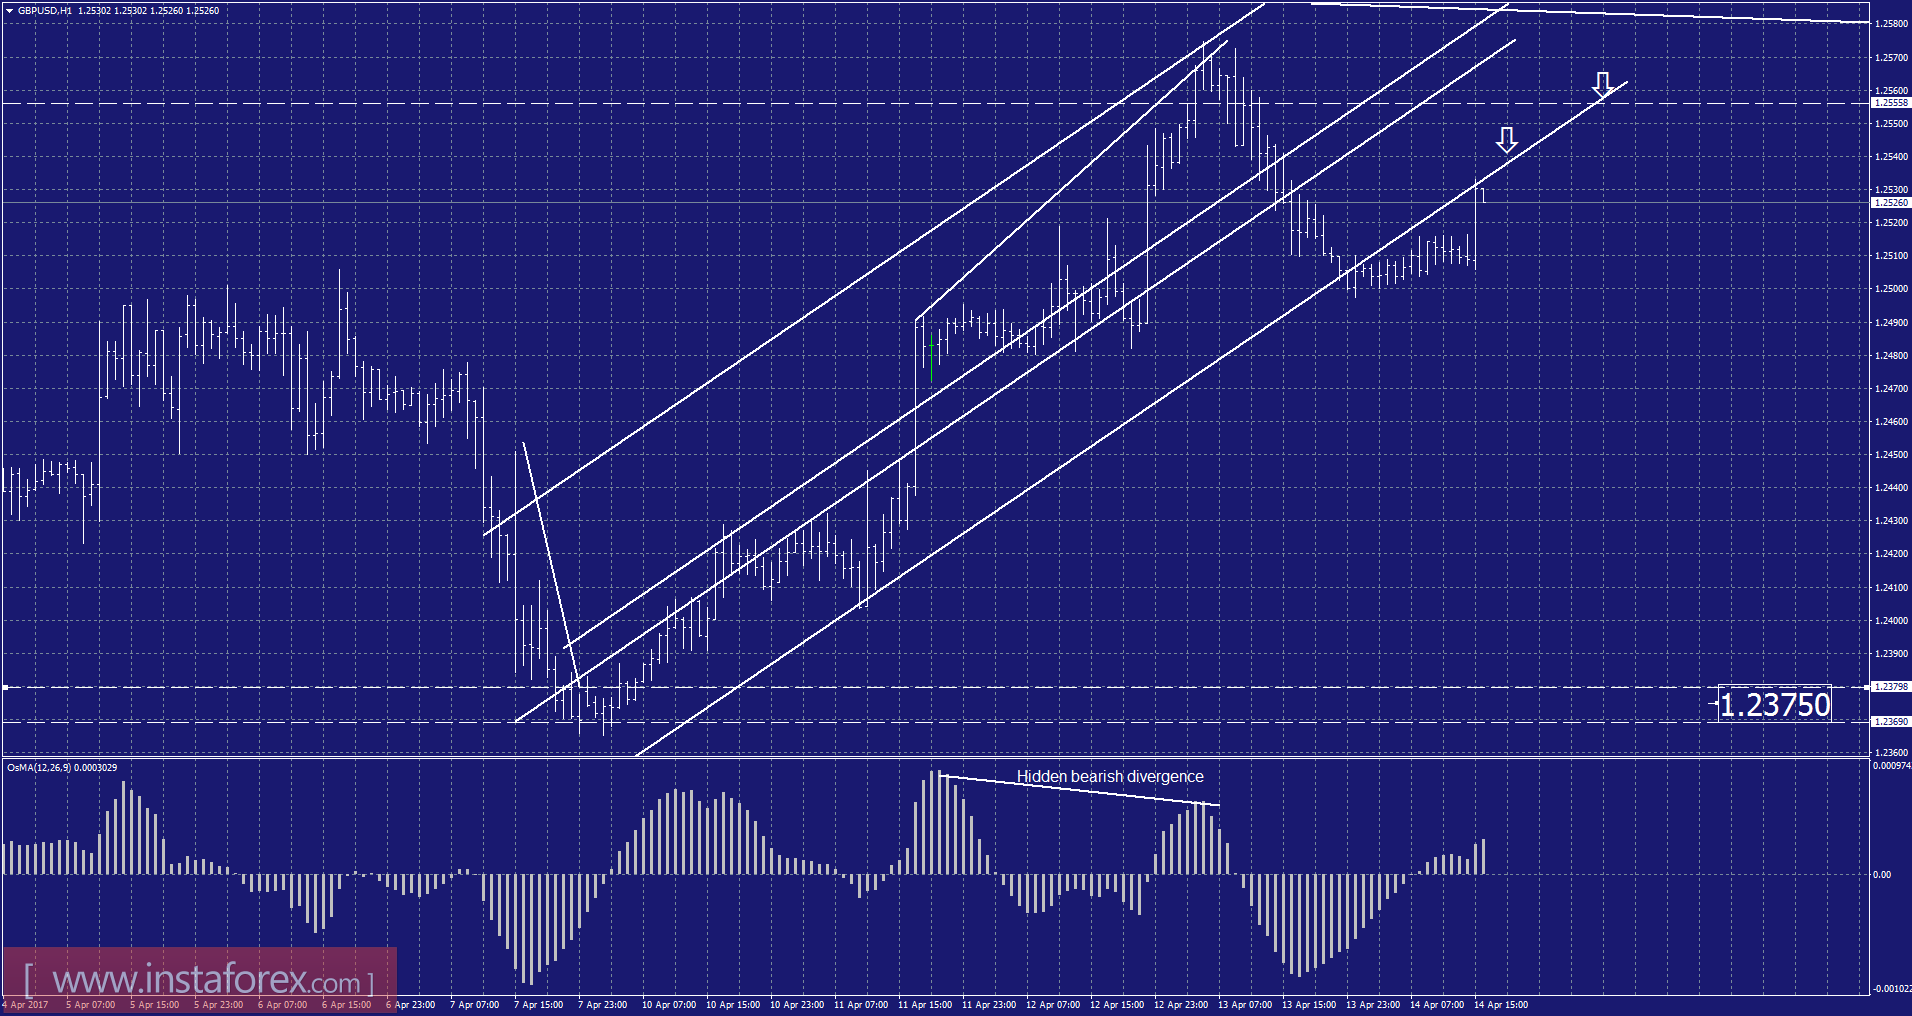
Recently, the GBP/USD has been trading sideways at the price of 1.2530. According to the 1H time frame, I found a broken broken upward trendline, which is a sign that buying looks risky. I found a hidden bearish divergence on the moving average oscilator, which is another sign of weakness. My advice is to watch for potetnial selling opportunities. The downward target is set at the price of 1.2375.
Resistance levels:
R1: 1.2520
R2: 1.2525
R3: 1.2530
Support levels:
S1: 1.2505
S2: 1.2500
S3: 1.2495
Trading recommendations for today: watch for potential selling opportunities.