 English
  Русский
 Bahasa Indonesia
 Bahasa Malay
 ไทย
ไทย Español
 Deutsch
 Български
 Français
 Tiếng Việt
 中文
中文 বাংলা
বাংলা हिन्दी
 Čeština
 Українська
 Română

USDX still finds dynamic resistance at the 200 SMA (H1 chart), in an effort to trigger a bearish catalyst that helps to strengthen further pullbacks toward the 100.00 handle. It seems that the index will look for a breakout above April 12nd highs and if that happens, then we can expect a rally to test the 100.97 zone.
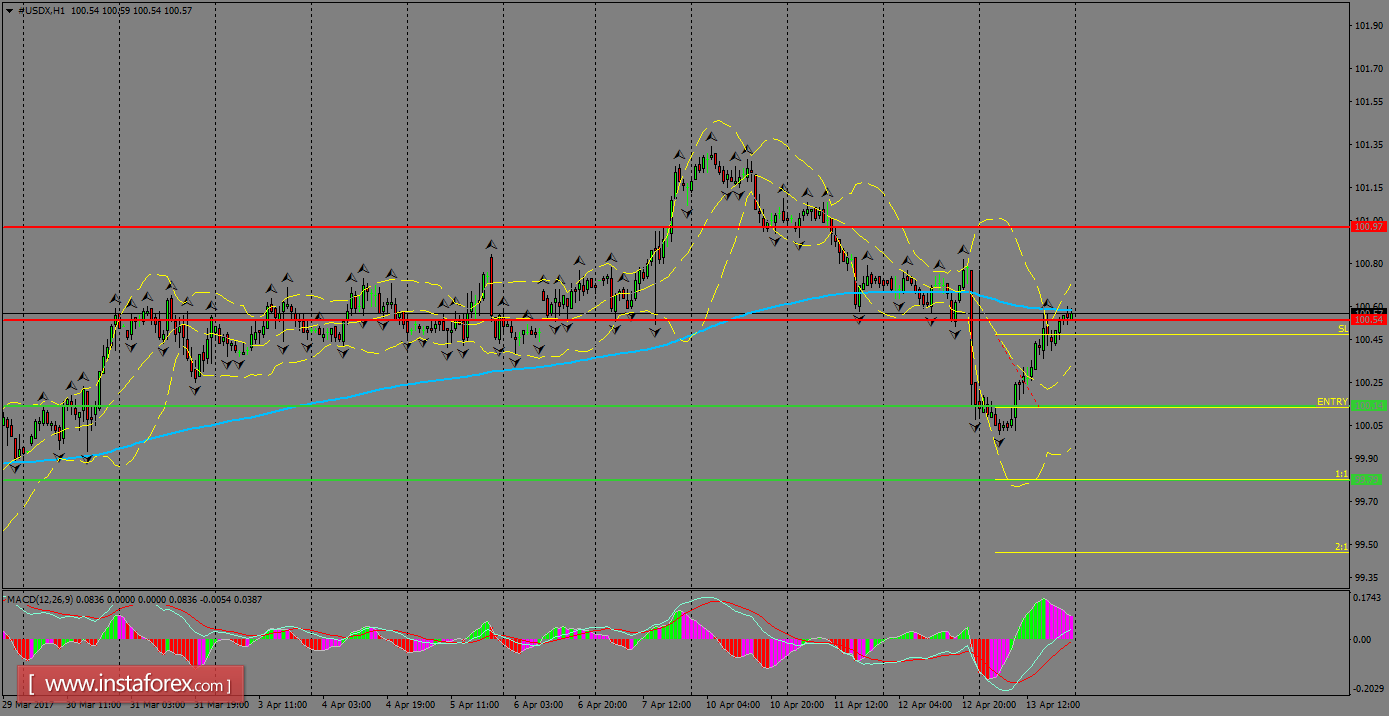
H1 chart's resistance levels: 100.54 / 100.97
H1 chart's support levels: 100.14 / 99.79
Trading recommendations for today: Based on the H1 chart, place sell (short) orders only if the USD Index breaks with a bearish candlestick; the support level is at 100.14, take profit is at 99.79 and stop loss is at 100.47.