 English
  Русский
 Bahasa Indonesia
 Bahasa Malay
 ไทย
ไทย Español
 Deutsch
 Български
 Français
 Tiếng Việt
 中文
中文 বাংলা
বাংলা हिन्दी
 Čeština
 Українська
 Română

The US dollar index reversed and got rejected at 101.30 when we expected it last week. Now it is in a short-term bearish trend. The price is in the important support area where we could see another upward turnaround.
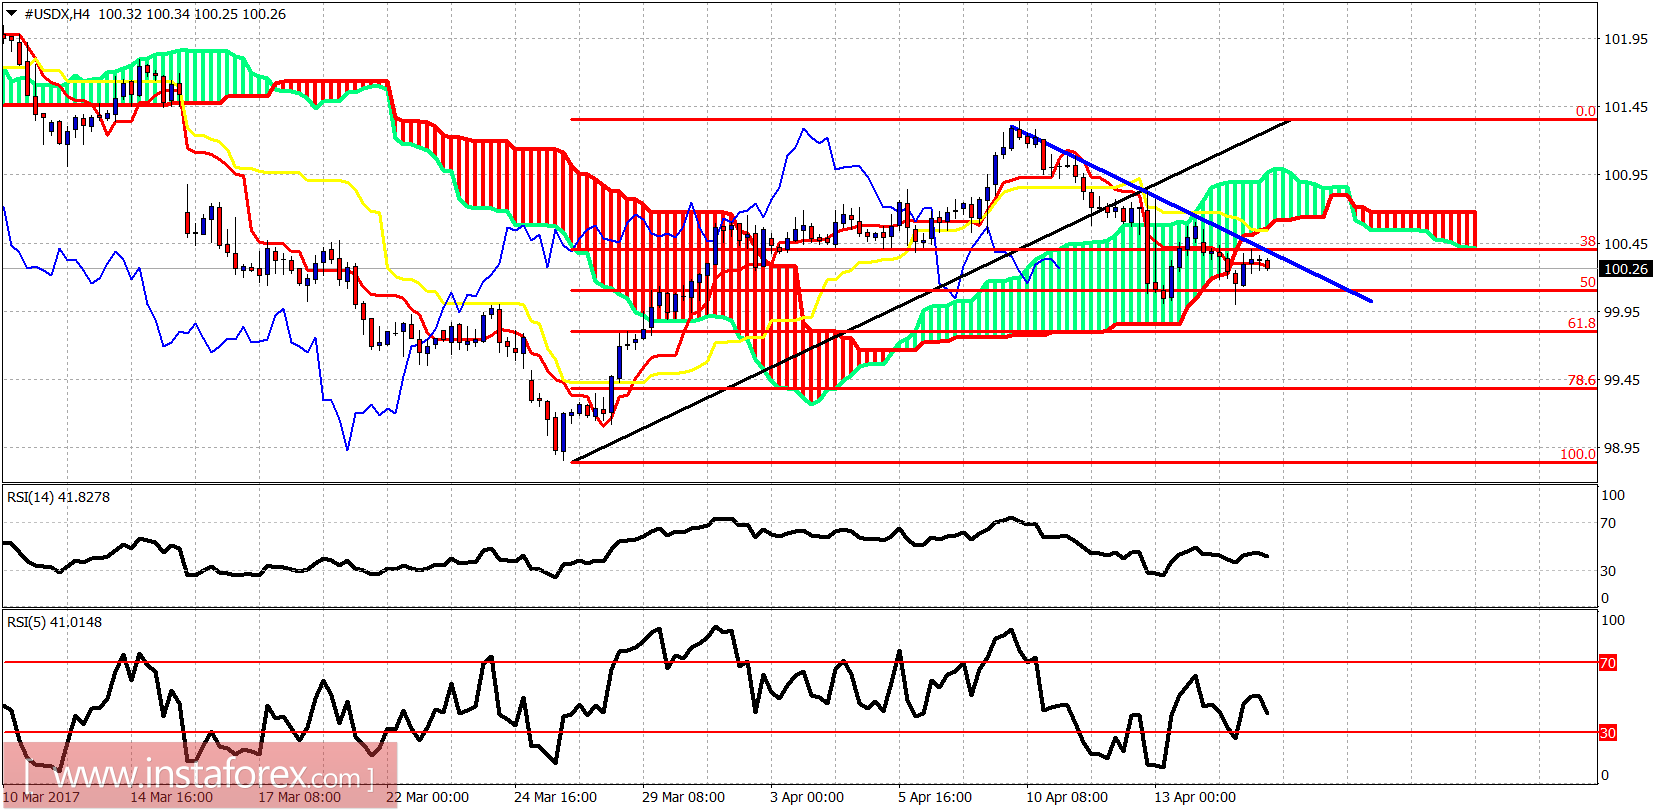
Blue line - short-term resistance trend line
The dollar index is trading below the 4 hour Kumo (cloud) and the blue trend line resistance. Resistance is found at 100.60. Support lies at 99.80 where we also find the 61.8% Fibonacci retracement of the latest upward move from the important lows at 98.80.
Black line - medium-term support trend line
Green line - long-term support trend line
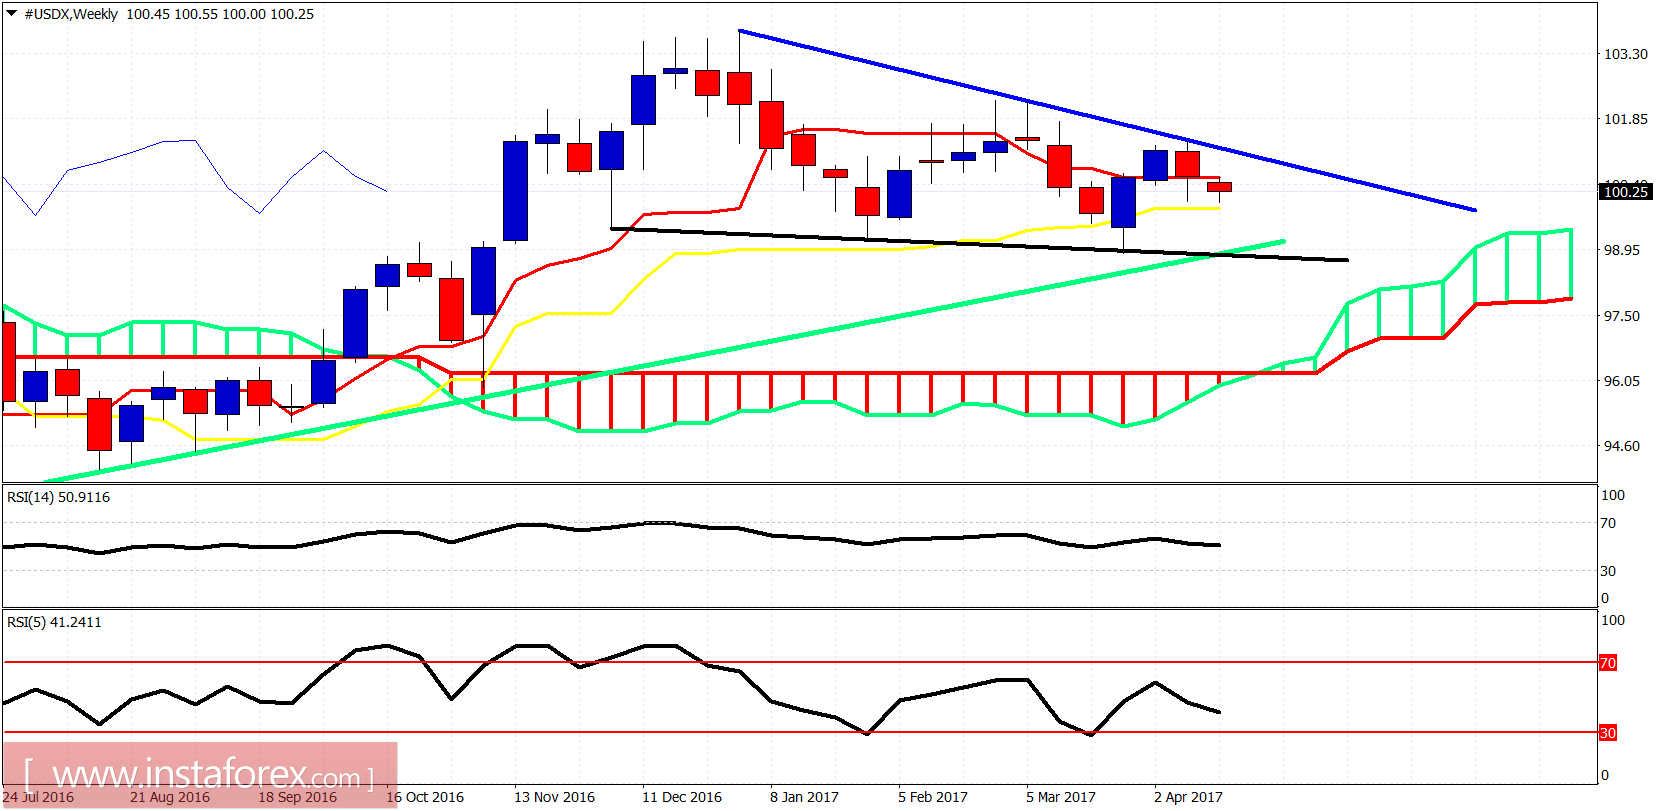
Weekly resistance remains in the area of 101.30-101.50 by the downward sloping trend line. Weekly support is at 99-98.80 where the medium-term and long-term support trend lines meet. Long-term trend remains bullish as price the holds above the Kumo (cloud). However, there will be intense warnings if the price closes below the weekly kijun-sen at 99.80.