 English
  Русский
 Bahasa Indonesia
 Bahasa Malay
 ไทย
ไทย Español
 Deutsch
 Български
 Français
 Tiếng Việt
 中文
中文 বাংলা
বাংলা हिन्दी
 Čeština
 Українська
 Română

GBP/USD gained strong bullish momentum on Tuesday following UK PM Theresa May's announcement of a snap election for June 8th. In a technical view, the pair managed to consolidate above the 1.2700 handle. During the American session, we saw another bullish wave to reach six months highs above 1.2800. The next resistance lies at 1.2875, where a breakout should expose the 1.3029 level.
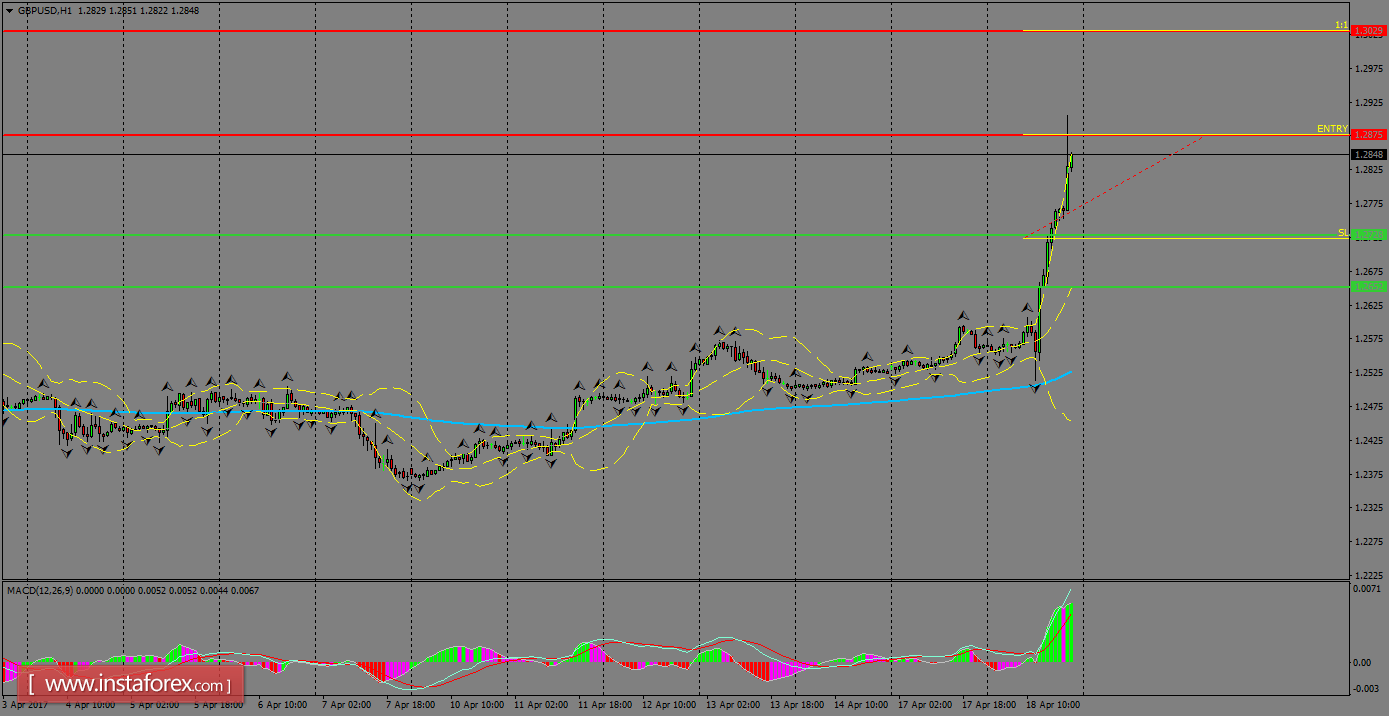
H1 chart's resistance levels: 1.2875 / 1.3029
H1 chart's support levels: 1.2728 / 1.2652
Trading recommendations for today: Based on the H1 chart, buy (long) orders only if the GBP/USD pair breaks a bullish candlestick; the resistance level is at 1.2875, take profit is at 1.3029 and stop loss is at 1.2723.