 English
  Русский
 Bahasa Indonesia
 Bahasa Malay
 ไทย
ไทย Español
 Deutsch
 Български
 Français
 Tiếng Việt
 中文
中文 বাংলা
বাংলা हिन्दी
 Čeština
 Українська
 Română

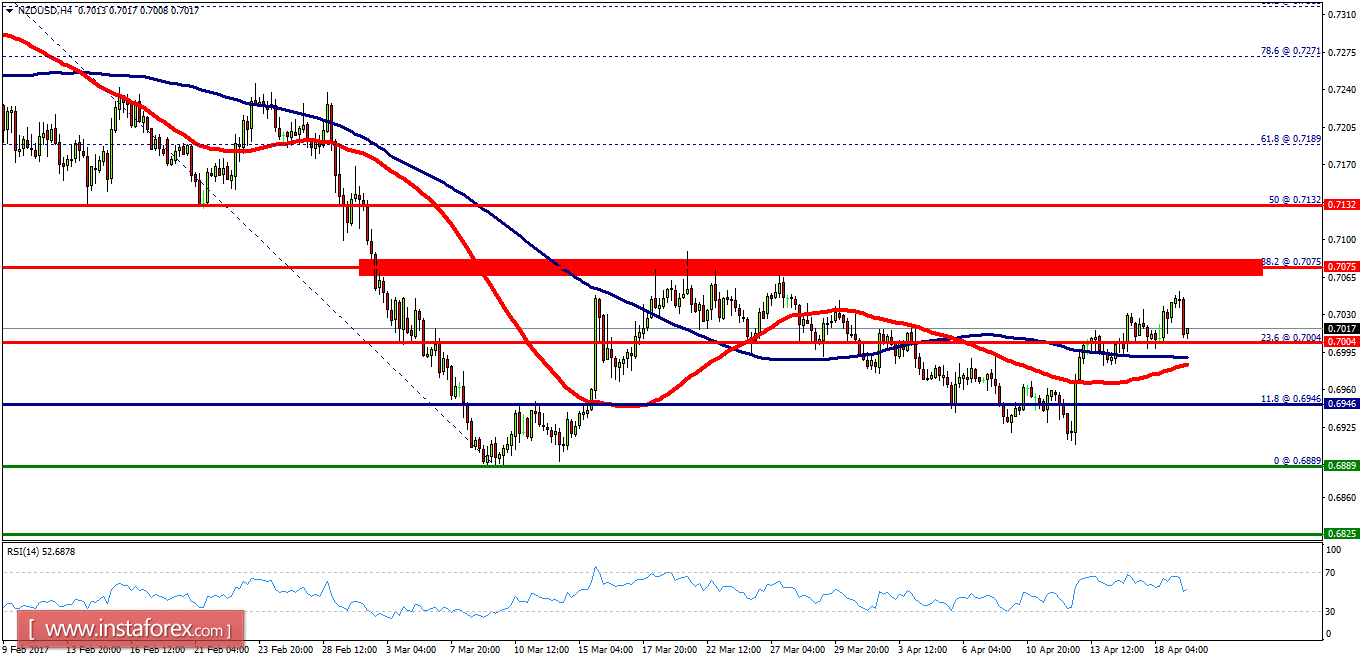
Overview:
- The NZD/USD pair fell from the level of 0.7075 towards 0.7004.
- The trend is still set below the 0.7075 level. The resistance of the NZD/USD pair is seen at the levels of 0.7075 and 0.7132.
- The first resistance and second one are seen at the levels of 0.7075 and 0.7132 respectively. The NZD/USD pair is still moving in a downtrend channel for a while. The price spot of 0.7075 remains a significant resistance area.
- Therefore, there is a possibility that the NZD/USD pair will move downside, and the structure of a fall does not look corrective. In order to indicate the bearish opportunity below the spot of 0.7075 - 0.7004, sell below 0.7075 - 0.7004 with the first target at 0.6969.
- It should be noted that support 1 is seen at the level of 0.6969 which coincides with the double bottom in the one-hour time frame. If the NZD/USD pair is able to break out the bottom at 0.6969, the market will decline further to 0.6825 in order to test the weekly support 2.
- On the other hand, the stop loss should be set above the level of 0.7132.