 English
  Русский
 Bahasa Indonesia
 Bahasa Malay
 ไทย
ไทย Español
 Deutsch
 Български
 Français
 Tiếng Việt
 中文
中文 বাংলা
বাংলা हिन्दी
 Čeština
 Українська
 Română

The pair is looking to break higher above 1.2875, as the bulls are trying to gather enough bullish momentum in order to invalidate that supply zone. However, GBP/USD has been in consolidation mode since April 18th and eventually, we could witness some corrective moves toward the 1.2728 level in a first degree. MACD indicator is turning positive.
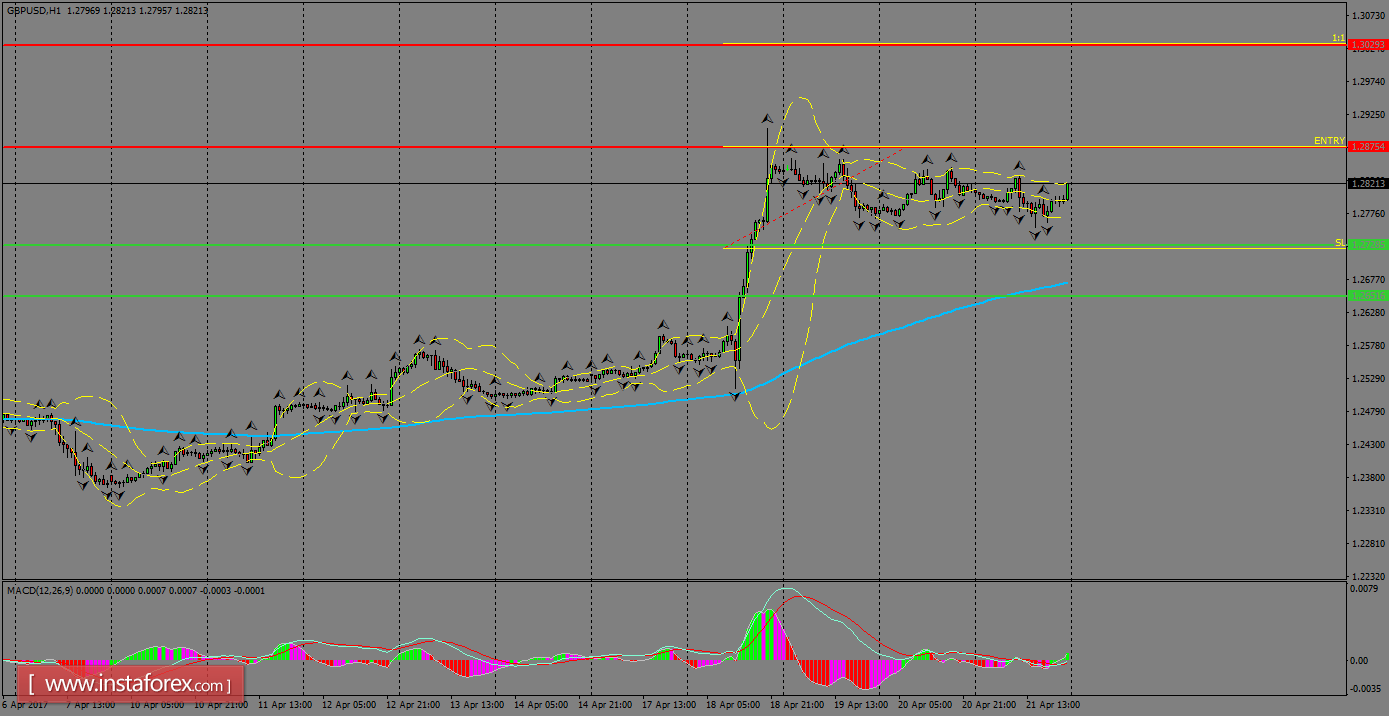
H1 chart's resistance levels: 1.2875 / 1.3029
H1 chart's support levels: 1.2728 / 1.2652
Trading recommendations for today: Based on the H1 chart, buy (long) orders only if the GBP/USD pair breaks a bullish candlestick; the resistance level is at 1.2875, take profit is at 1.3029 and stop loss is at 1.2723.