 English
  Русский
 Bahasa Indonesia
 Bahasa Malay
 ไทย
ไทย Español
 Deutsch
 Български
 Français
 Tiếng Việt
 中文
中文 বাংলা
বাংলা हिन्दी
 Čeština
 Українська
 Română

The Dollar index continues to trade above the 99-98.80 support area but the sideways consolidation in the short-term implies that more downside is expected. The downward move is not over but the risk reward does not favor bears.
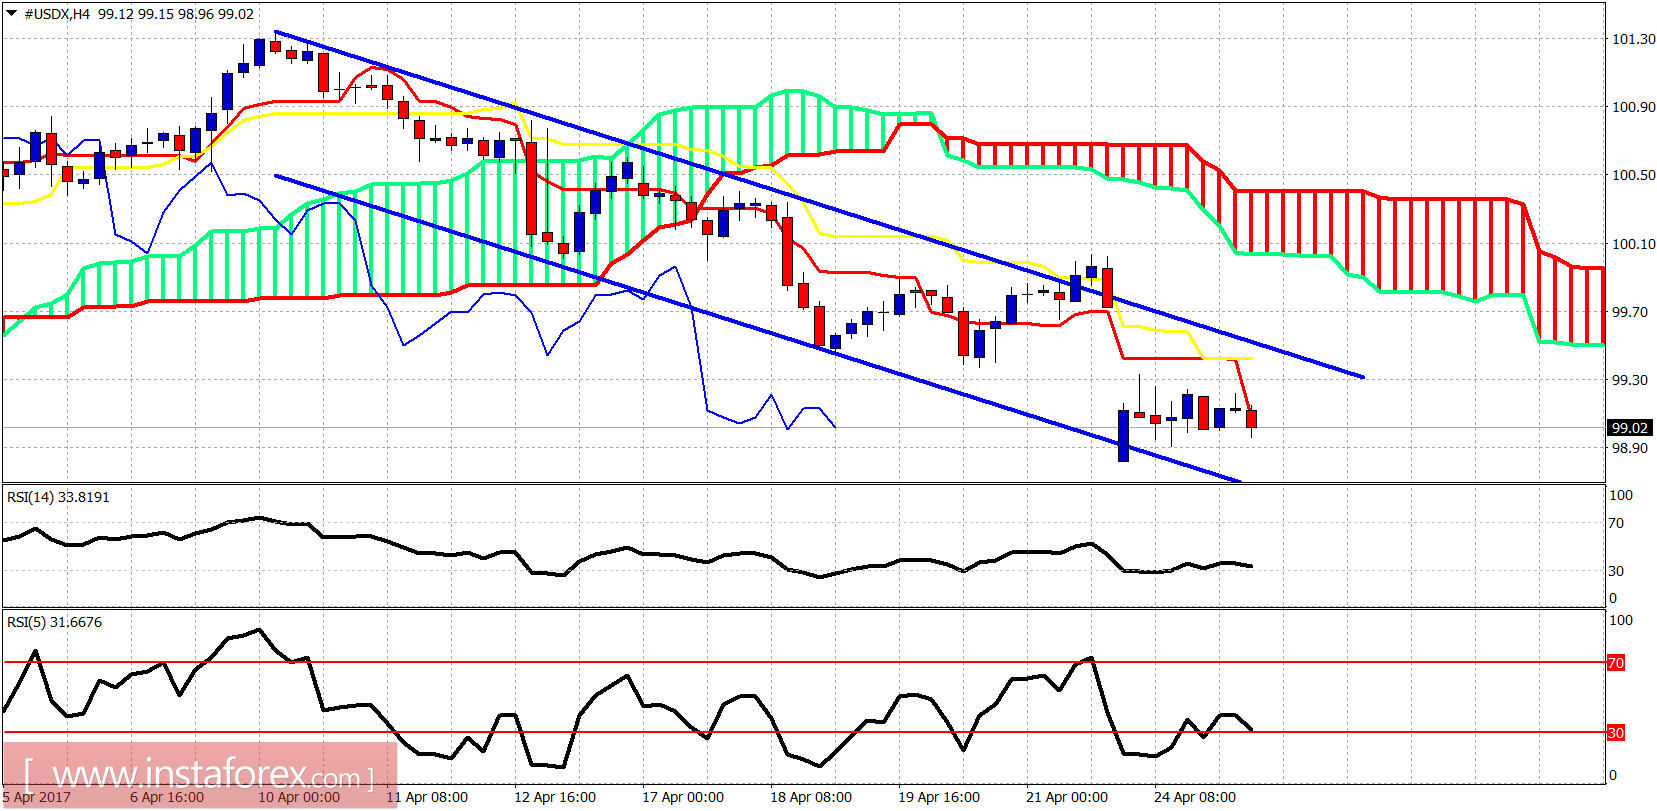
Short-term support is at 98.80. Resistance is at 99.30-99.50. Price remains in a bearish trend below both the tenkan- and kijun-sen indicators. Price is expected to make new lows towards 98 before it reverses upwards. Short-term indicators are diverging.
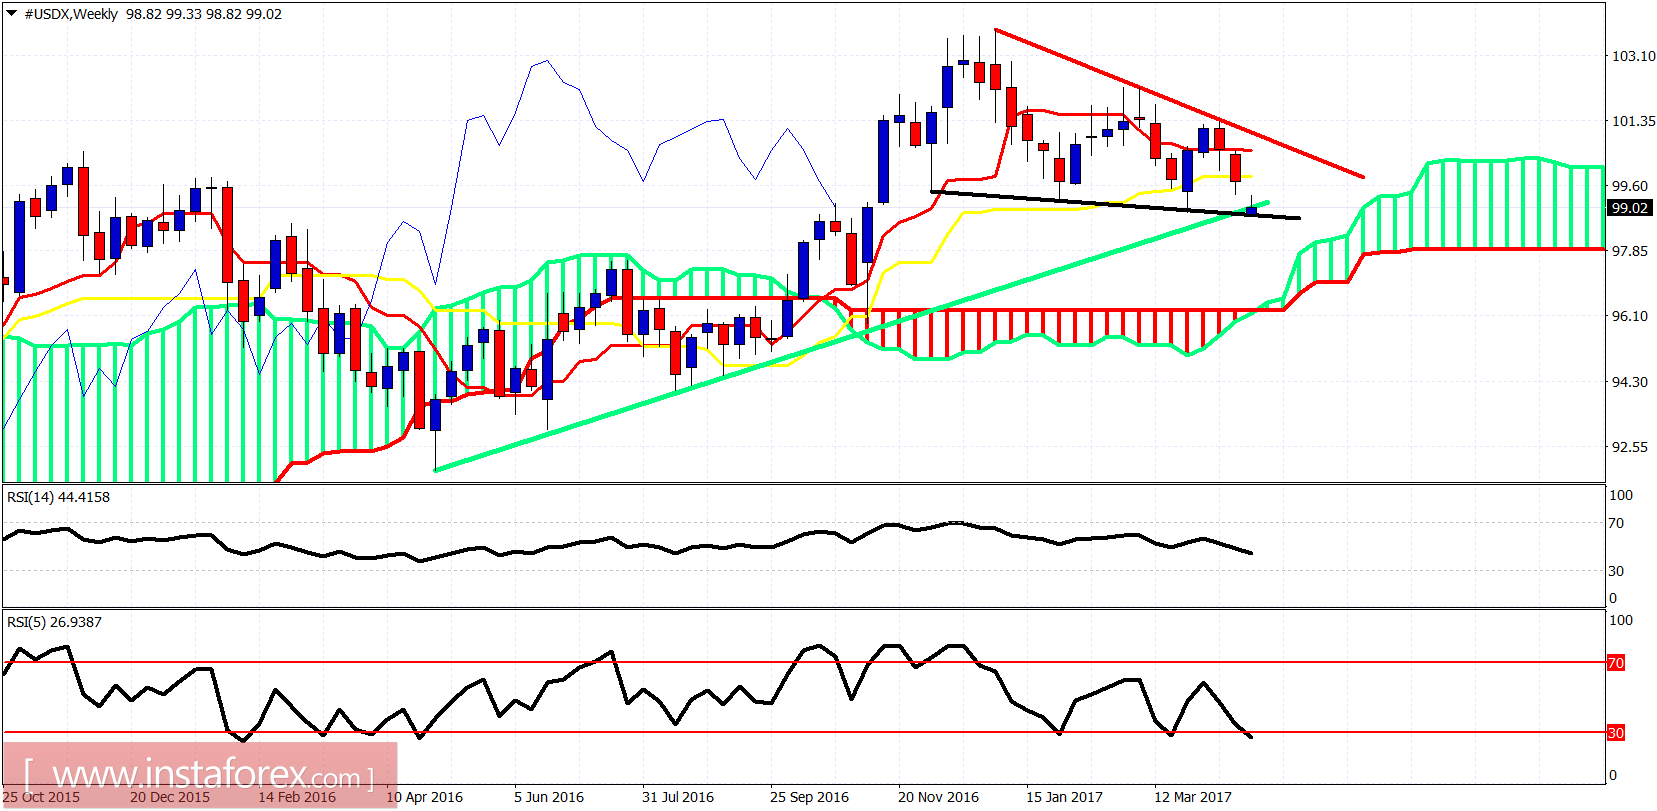
Black line - support
Green line - long-term support trend line
The weekly candle is below both the tenkan- and kijun-sen but above the Kumo (cloud). Trend is bearish as long as price is below 101.30 and the longer-term trend is also in danger if price breaks below the Kumo. If price breaks below the green long-term trend line the chances for a bounce towards the red resistance trend line diminish.