Gold, as expected, bounced towards short-term cloud resistance but got rejected. Recent lows are important short-term support. A break above yesterday highs could signal that an important short-term low is in.
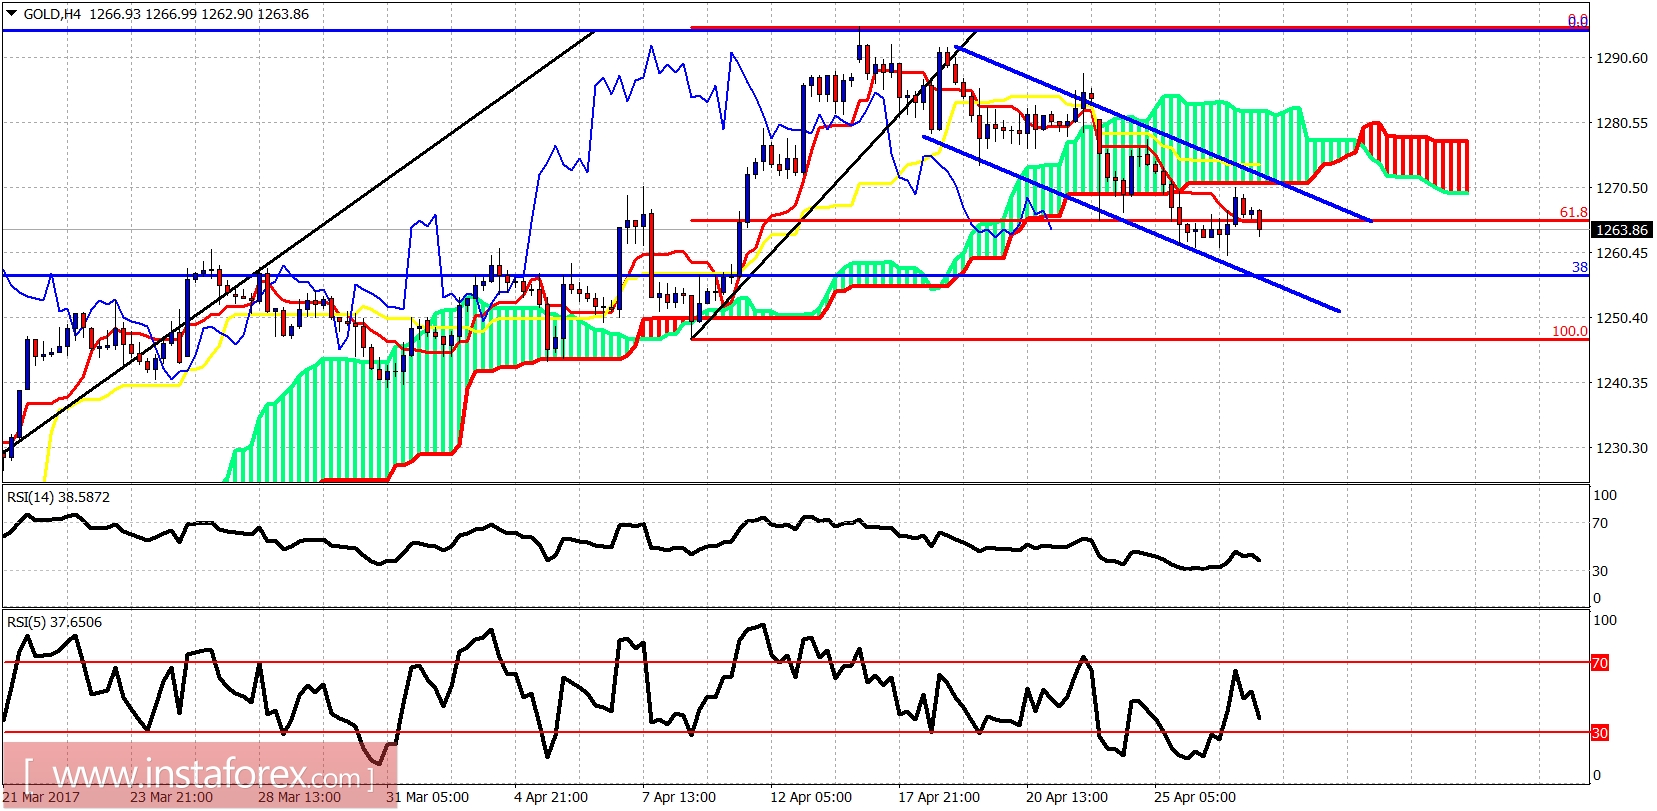
Gold price is trading below the Kumo (cloud) of the 4-hour chart. Price is still inside the bearish channel and yesterday it reached the lower cloud boundary resistance and got rejected. Resistance is at $1,271. Support is at $1,260. Breaking support will push it to $1,250-45. Breaking resistance will push it to $1,285.
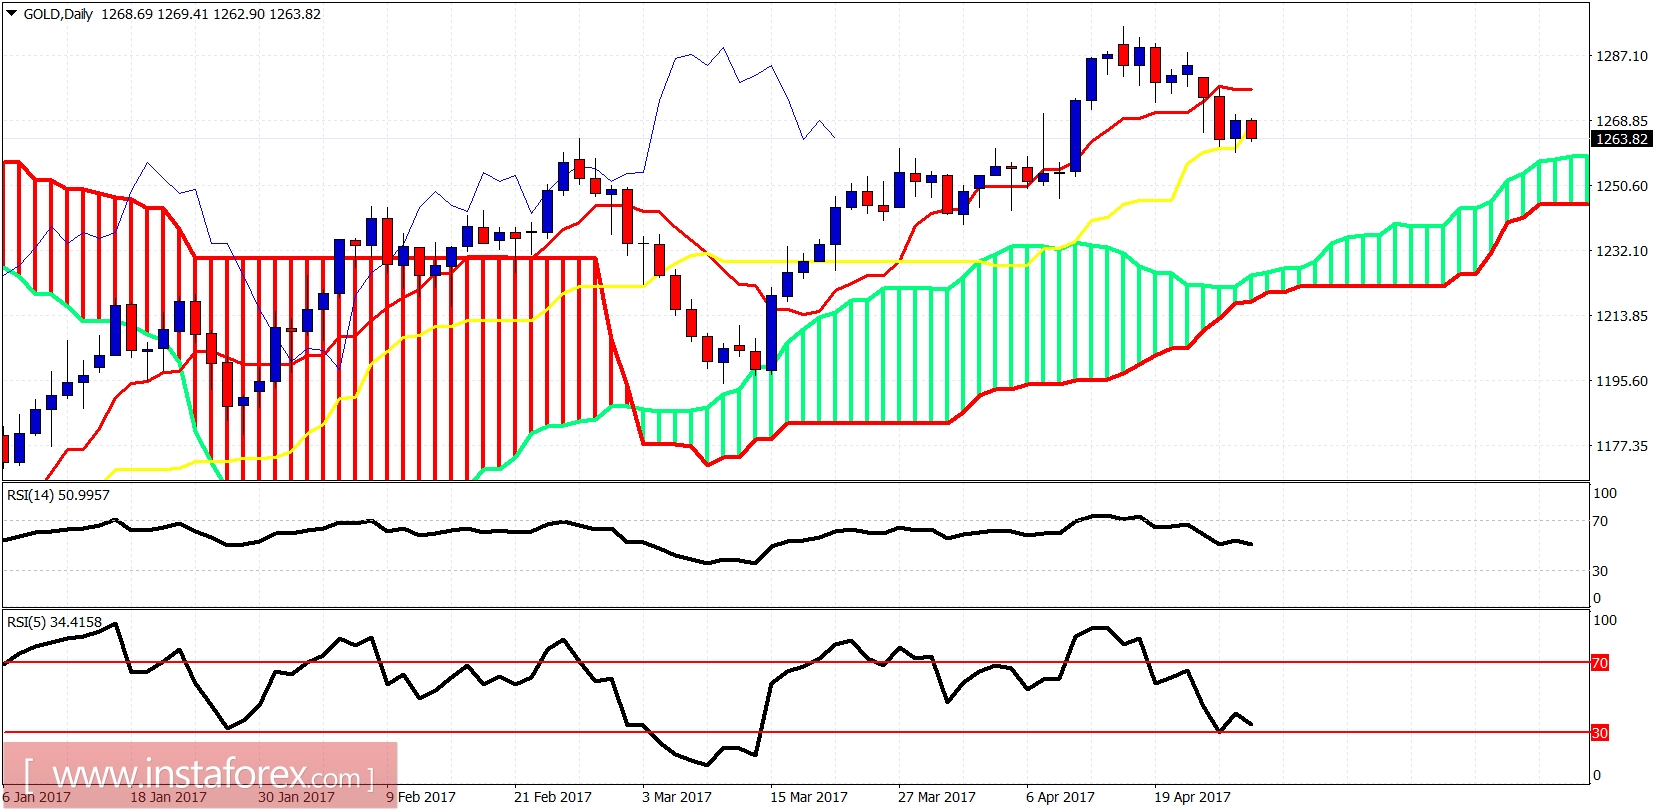
Daily Gold price candles are trading right above the kijun-sen support indicator. Price could reverse to the upside from current levels and bulls should use $1,260 as a stop for short-term trades. My long-term bullish view remains unchanged.
*The market analysis posted here is meant to increase your awareness, but not to give instructions to make a trade
 English
  Русский
 Bahasa Indonesia
 Bahasa Malay
 ไทย
ไทย Español
 Deutsch
 Български
 Français
 Tiếng Việt
 中文
中文 বাংলা
বাংলা हिन्दी
 Čeština
 Українська
 Română
 Long-term review