 English
  Русский
 Bahasa Indonesia
 Bahasa Malay
 ไทย
ไทย Español
 Deutsch
 Български
 Français
 Tiếng Việt
 中文
中文 বাংলা
বাংলা हिन्दी
 Čeština
 Українська
 Română

The index is now capped by the resistance level of 99.28, as the bulls are trying to gather enough bullish momentum to perform a breakout to the upside. However, a pullback might happen to re-test the support area of 98.83. The 200 SMA on H1 chart remains an active dynamic supply zone to cap further gains. MACD indicator is turning neutral, supporting a sideways tone for USDX in the coming days.
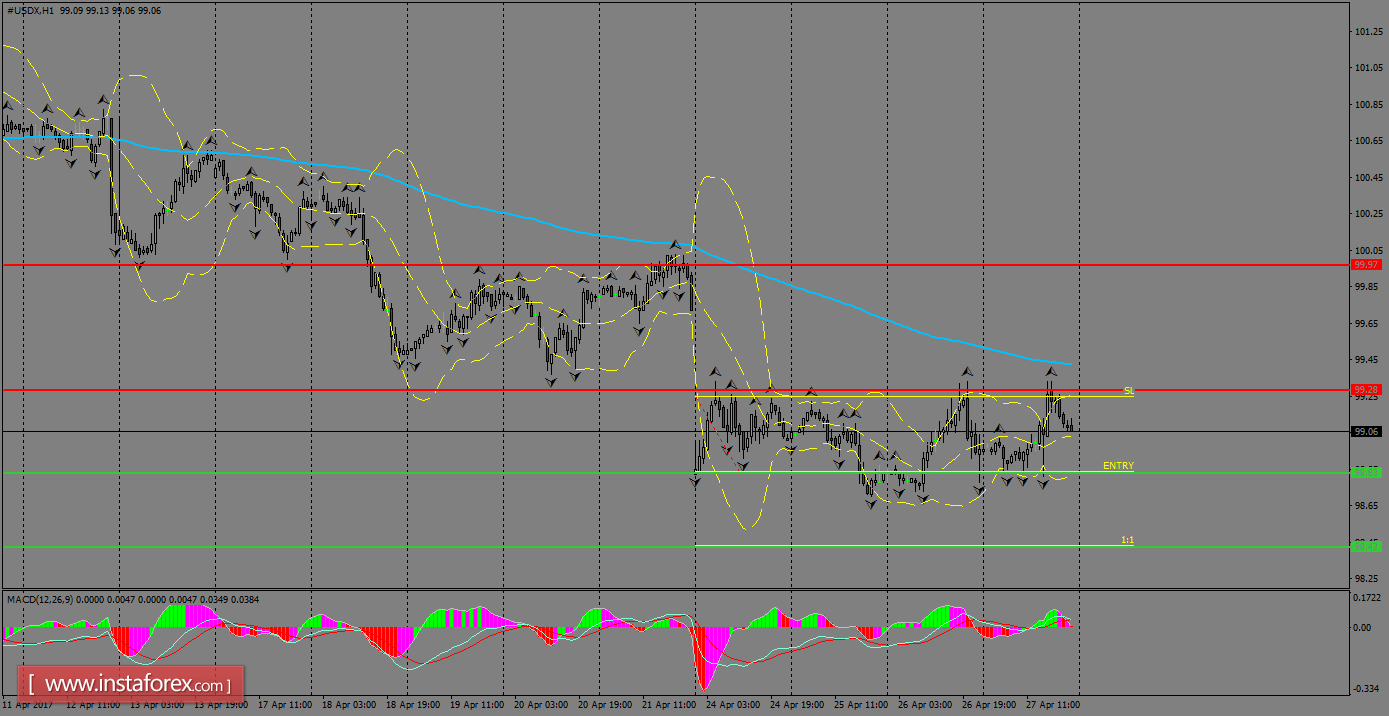
H1 chart's resistance levels: 99.28 / 99.97
H1 chart's support levels: 98.83 / 98.42
Trading recommendations for today: Based on the H1 chart, place sell (short) orders only if the USD Index breaks with a bearish candlestick; the support level is at 98.83, take profit is at 98.42 and stop loss is at 99.24.