 English
  Русский
 Bahasa Indonesia
 Bahasa Malay
 ไทย
ไทย Español
 Deutsch
 Български
 Français
 Tiếng Việt
 中文
中文 বাংলা
বাংলা हिन्दी
 Čeština
 Українська
 Română

GBP/USD is looking to break above 1.2957, as the bulls gathered momentum across the board during last week. However, this rise has been done above the 200 SMA in the H1 chart in a slow tone. If that level gives up to the upside, it can rally to test the resistance zone of 1.3029. MACD indicator is turning flat, forecasting some sideways.
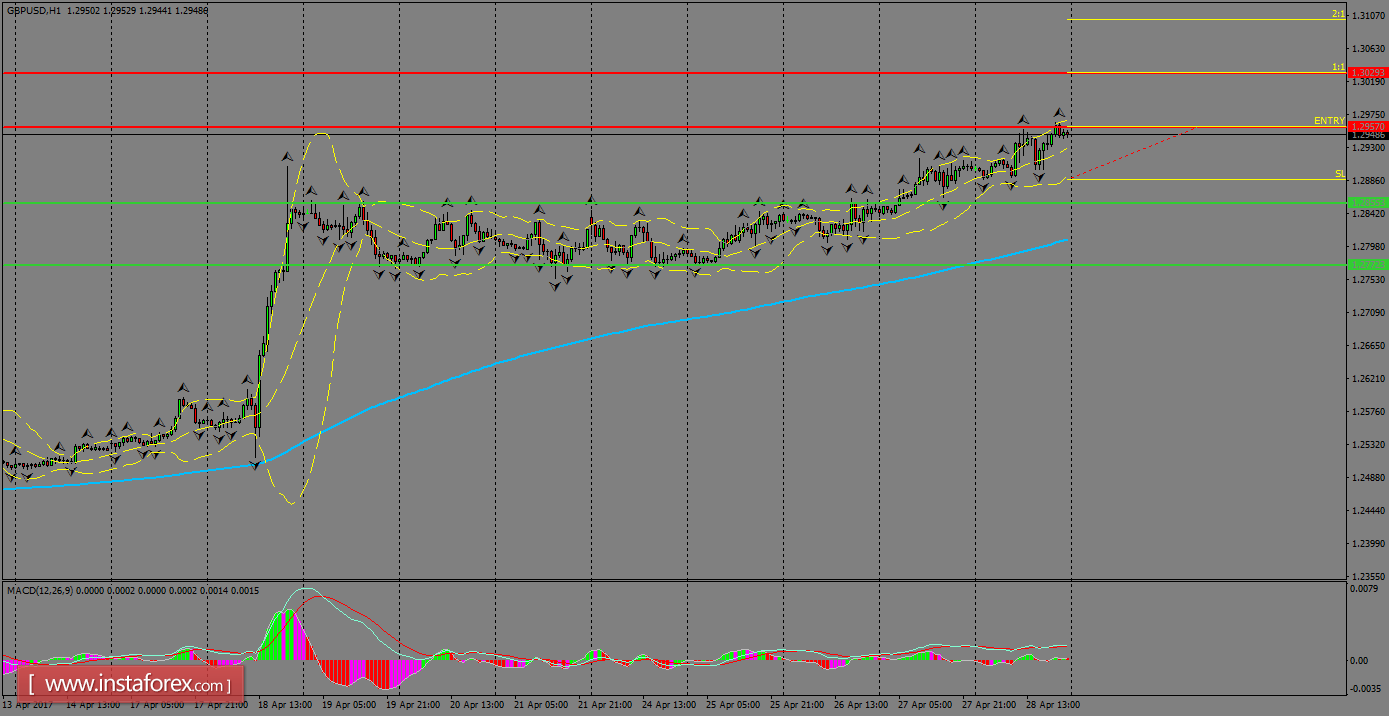
H1 chart's resistance levels: 1.2957 / 1.3029
H1 chart's support levels: 1.2855 / 1.2652
Trading recommendations for today: Based on the H1 chart, buy (long) orders only if the GBP/USD pair breaks a bullish candlestick; the resistance level is at 1.2957, take profit is at 1.3029 and stop loss is at 1.2887.