 English
  Русский
 Bahasa Indonesia
 Bahasa Malay
 ไทย
ไทย Español
 Deutsch
 Български
 Français
 Tiếng Việt
 中文
中文 বাংলা
বাংলা हिन्दी
 Čeština
 Українська
 Română

The pair holds the support zone of 1.2855, as the week starts with holidays in most of the countries. The resistance level of 1.2957 still provides a strong barrier for buyers and it's helping to cap further caps for the short-term. In the scenario that we witness a breakout below 1.2855, we might expect a decline to test the 1.2772 zone.
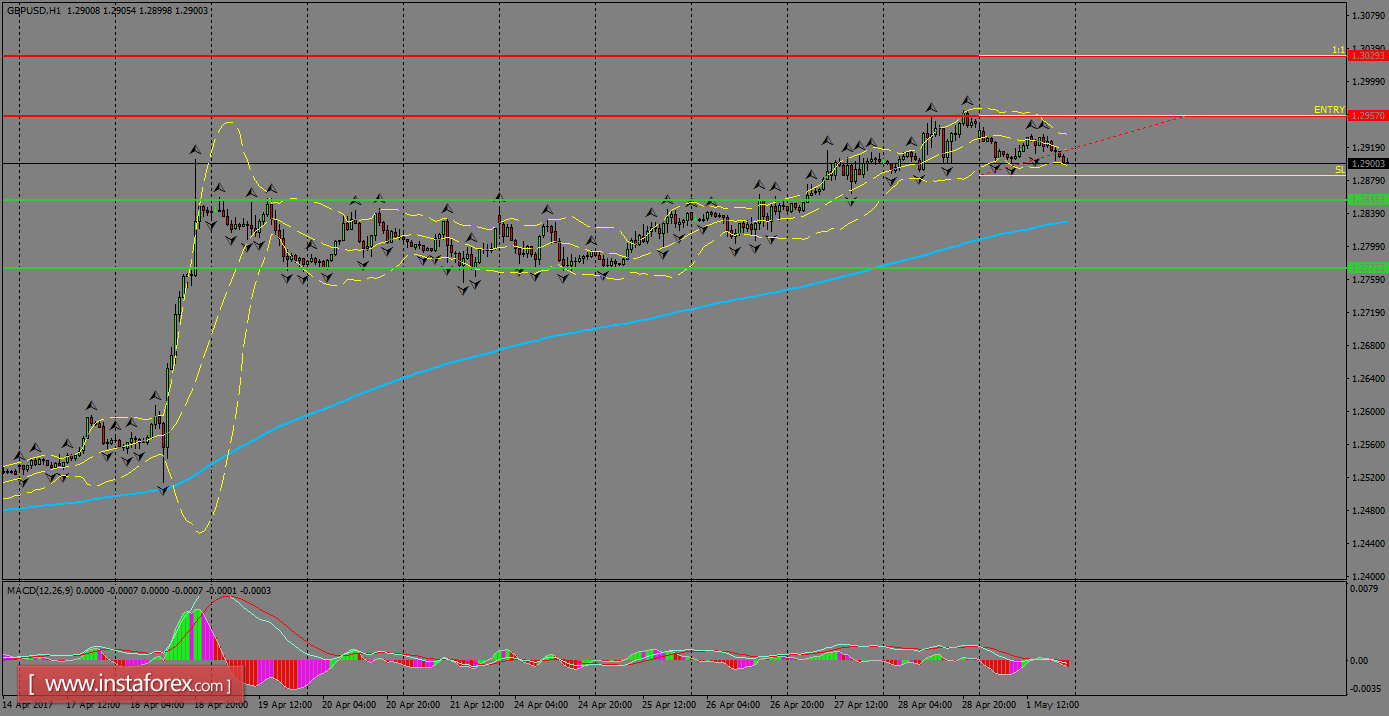
H1 chart's resistance levels: 1.2957 / 1.3029
H1 chart's support levels: 1.2855 / 1.2652
Trading recommendations for today: Based on the H1 chart, buy (long) orders only if the GBP/USD pair breaks a bullish candlestick; the resistance level is at 1.2957, take profit is at 1.3029 and stop loss is at 1.2887.