 English
  Русский
 Bahasa Indonesia
 Bahasa Malay
 ไทย
ไทย Español
 Deutsch
 Български
 Français
 Tiếng Việt
 中文
中文 বাংলা
বাংলা हिन्दी
 Čeština
 Українська
 Română

The index is still finding demand over the support level of 98.83 and it remains confined within a narrow range below the 200 SMA at H1 chart. If that area gives up, then we can expect a decline to test the next target to the downside around 98.42. However, as the bearish gap hasn't been filled up yet, USDX can attempt a breakout above 99.28 to test the 100.00 psychological level.
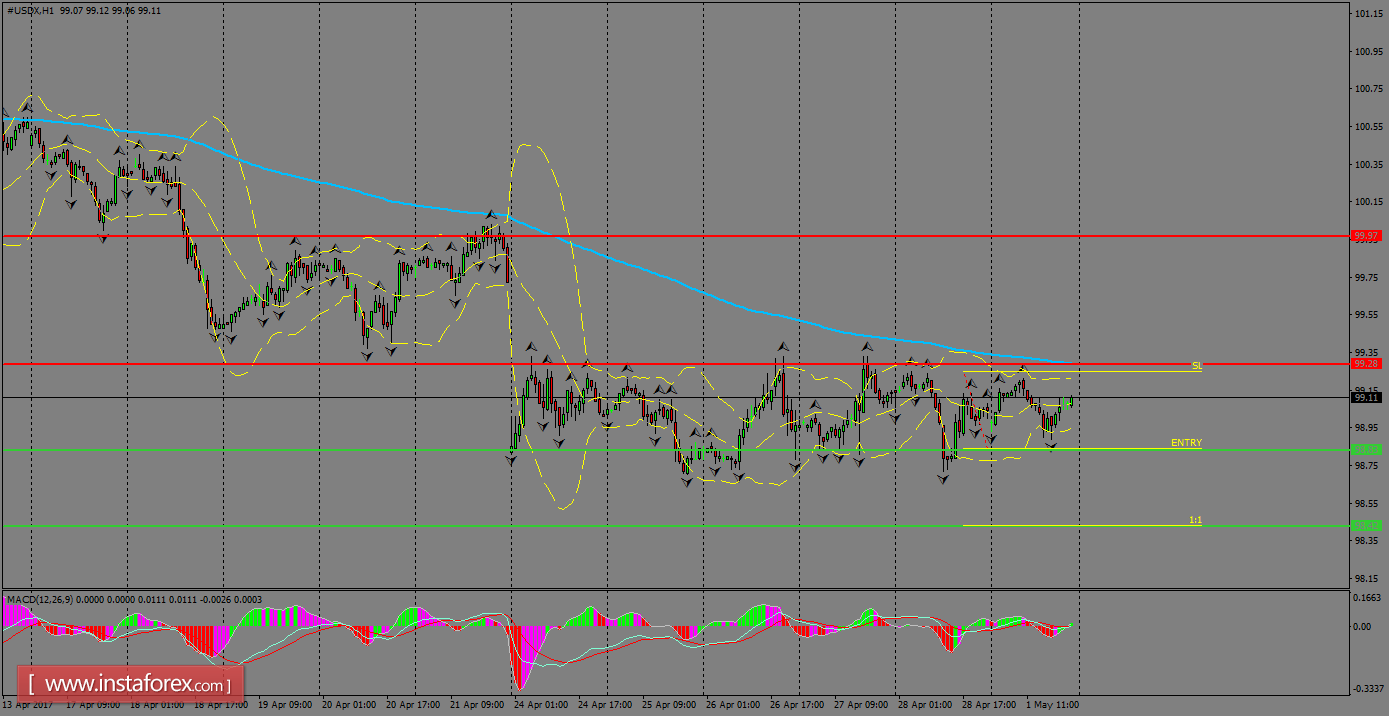
H1 chart's resistance levels: 99.28 / 99.97
H1 chart's support levels: 98.83 / 98.42
Trading recommendations for today: Based on the H1 chart, place sell (short) orders only if the USD Index breaks with a bearish candlestick; the support level is at 98.83, take profit is at 98.42 and stop loss is at 99.24.