 English
  Русский
 Bahasa Indonesia
 Bahasa Malay
 ไทย
ไทย Español
 Deutsch
 Български
 Français
 Tiếng Việt
 中文
中文 বাংলা
বাংলা हिन्दी
 Čeština
 Українська
 Română

Gold price remains in a bearish short-term trend, correcting the entire rise from $1,194. The price has reached the important Fibonacci support levels although the possibility of a move by $10-15 lower is still possible. Overall, my longer-term bullish view remains intact.
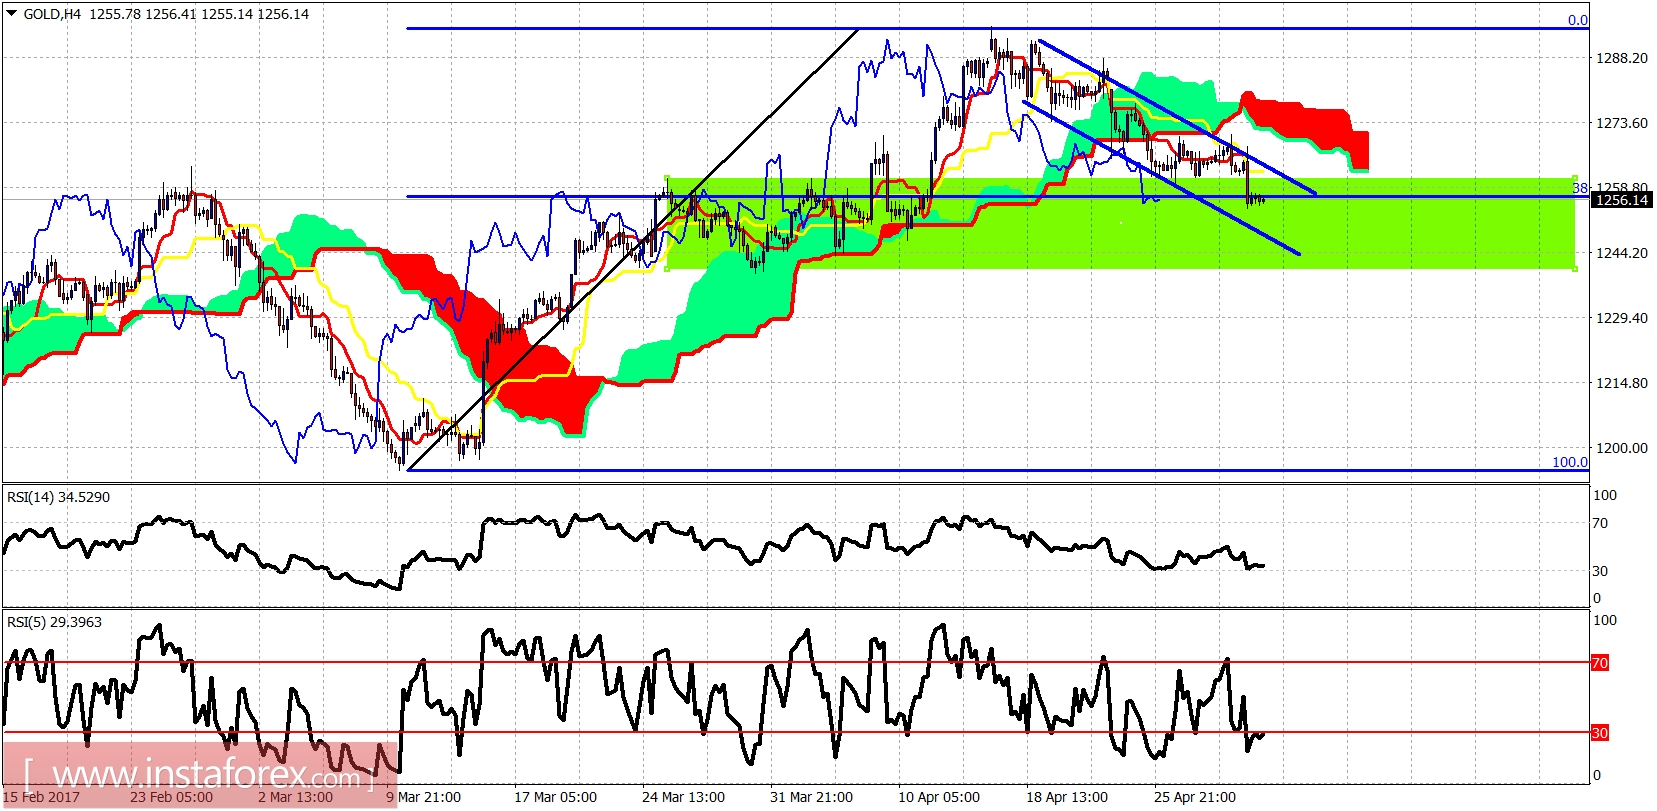
Blue lines - bearish channel
Gold price has just entered the important long-term support area. The price is trading below the 4 hour Kumo (cloud) confirming the bearish short-term trend. Moreover, the price is still inside the bearish blue channel. A break above $1,272 will open the way for a reversal. Support lies at $1,250-45 area now.
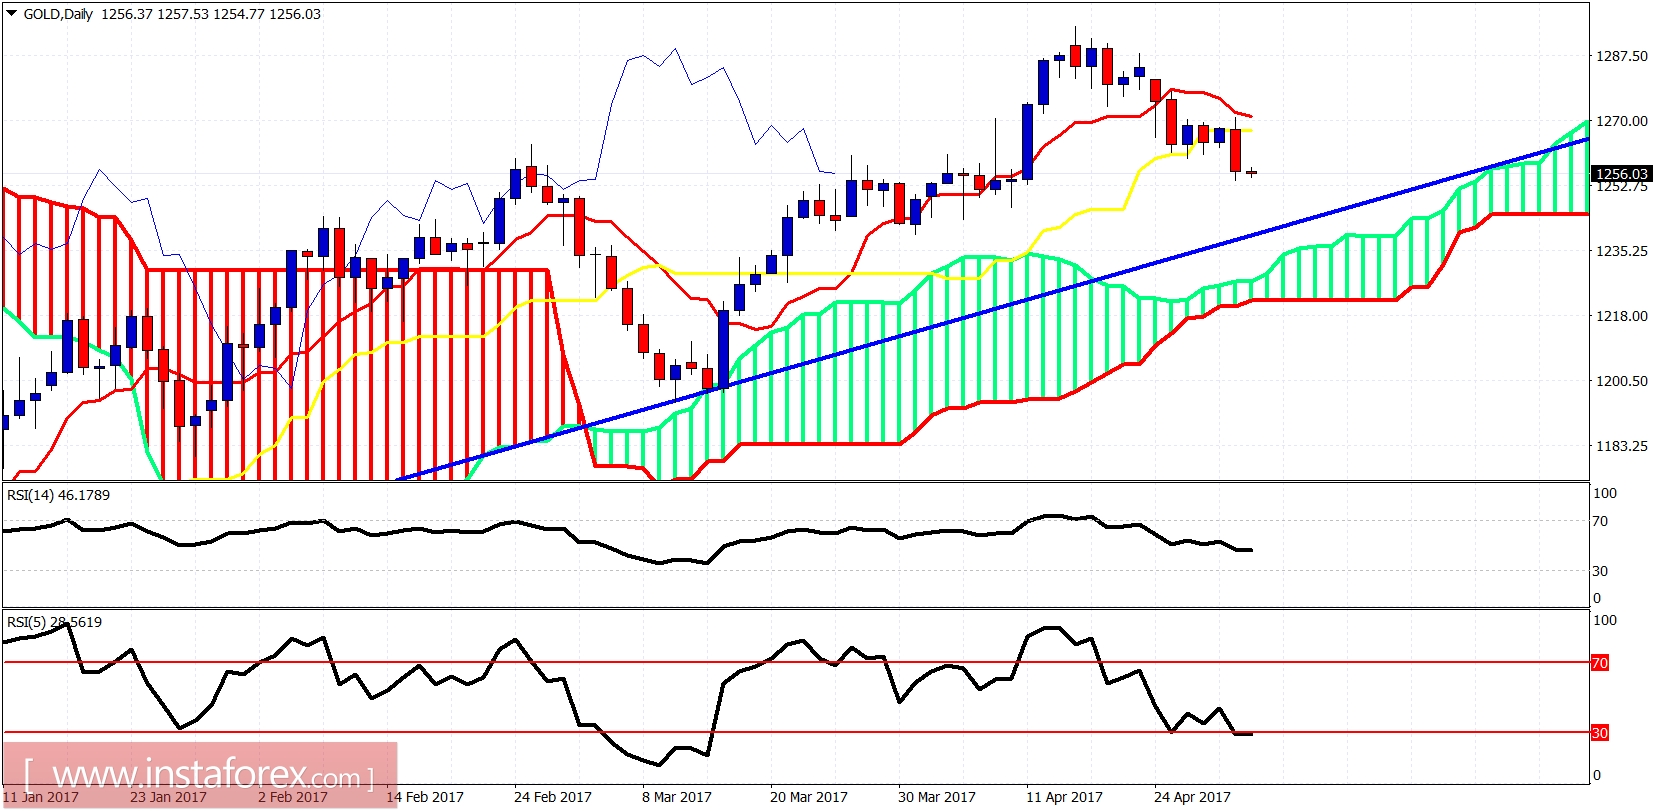
Gold price has broken below both the tenkan- and kijun-sen indicators on the daily chart. The price is heading towards the trend line and cloud support at $1,240-45. The short-term trend is bearish. However, I expect gold price to reverse from current or lower levels for a move towards $1,320-40.