 English
  Русский
 Bahasa Indonesia
 Bahasa Malay
 ไทย
ไทย Español
 Deutsch
 Български
 Français
 Tiếng Việt
 中文
中文 বাংলা
বাংলা हिन्दी
 Čeština
 Українська
 Română

Gold price is close to bottoming. Gold price has limited downside potential and could go as low as $1,245. I cannot see it lower than that area. Gold is expected to bounce strongly towards $1,300 and higher after the coming reversal.
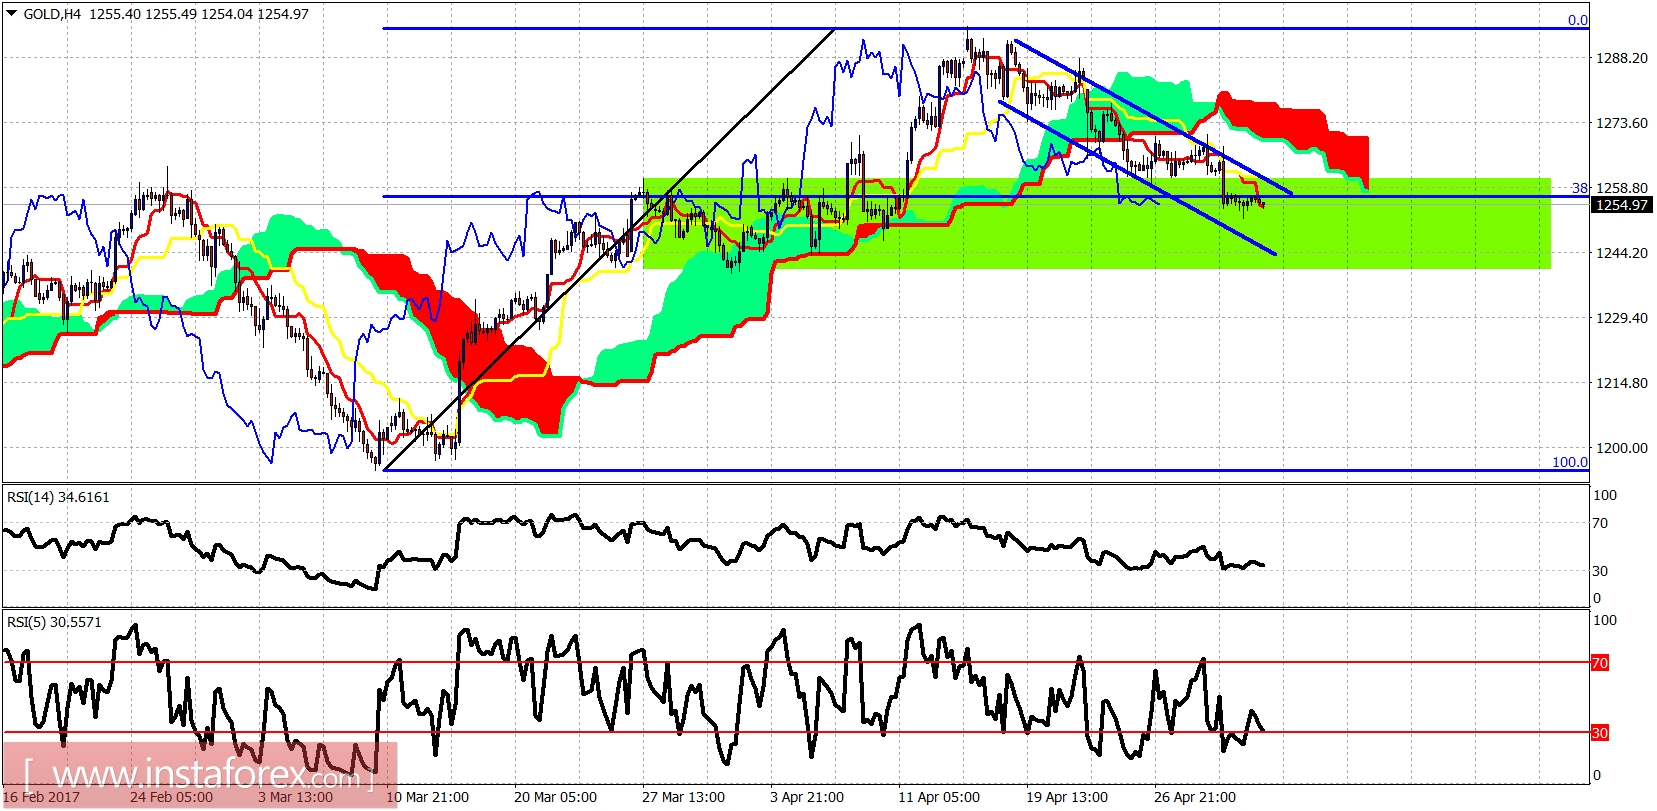
Green rectangle - support area
Gold price is inside the green rectangle support area. Price is below both the tenkan- and kijun-sen indicators. Trend is bearish for the short term. Short-term resistance is at $1,262. Next important resistance is at $1,272. Bulls need to break these levels to confirm a reversal.
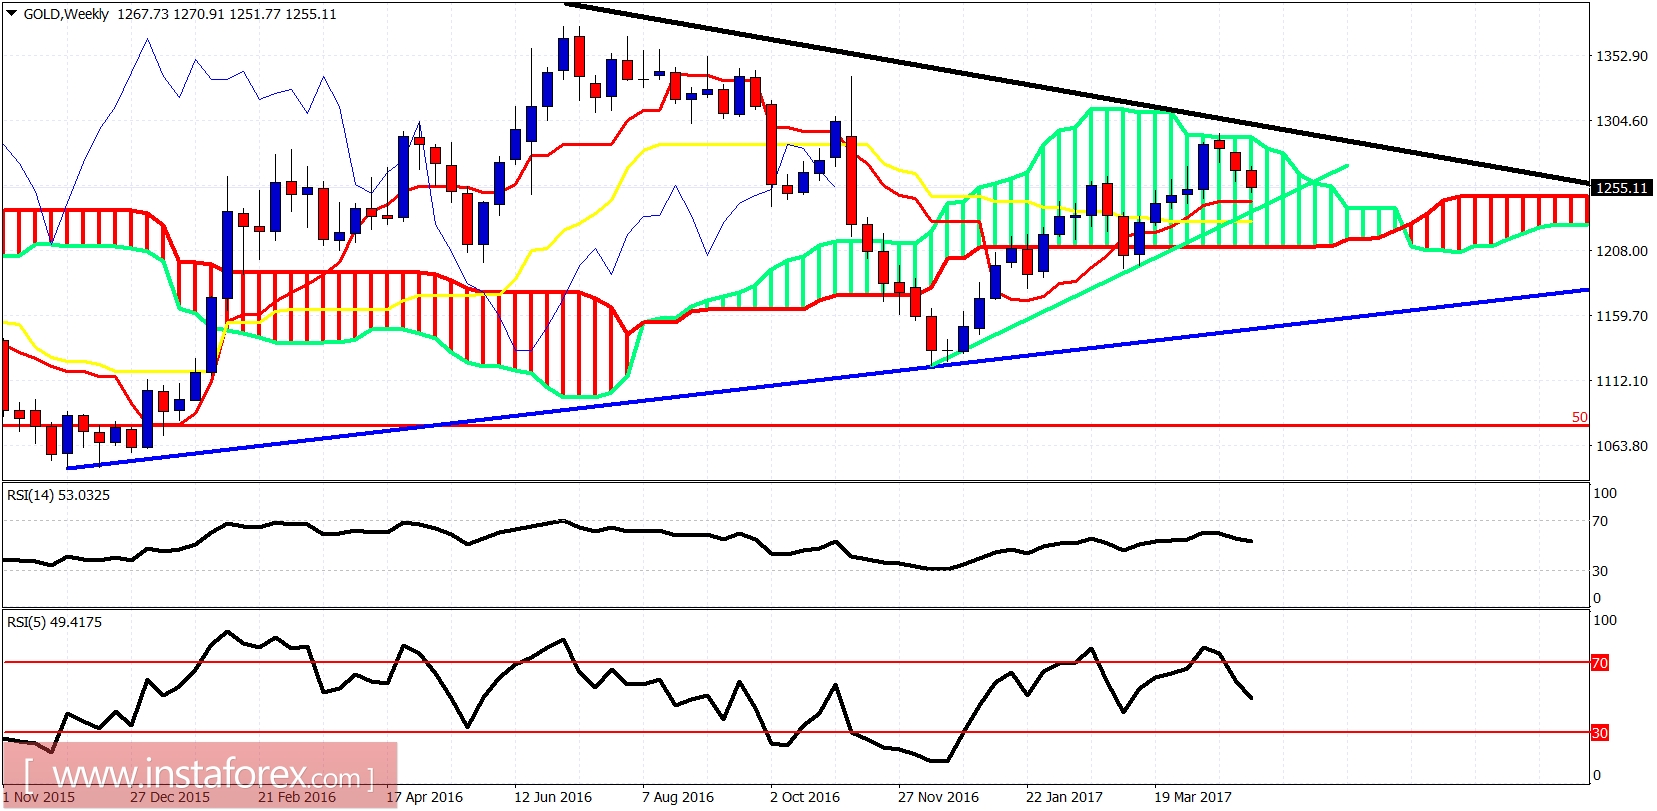
Blue line - long-term support trend line
Green line - medium term support trend line
Gold price is trading inside the Kumo. Trend is neutral. Price is above both the tenkan- and kijun-sen. Price is also above the green medium-term support trend line. I expect this trend line to hold and price bounce upwards strongly above the long-term trend line resistance.