 English
  Русский
 Bahasa Indonesia
 Bahasa Malay
 ไทย
ไทย Español
 Deutsch
 Български
 Français
 Tiếng Việt
 中文
中文 বাংলা
বাংলা हिन्दी
 Čeština
 Українська
 Română

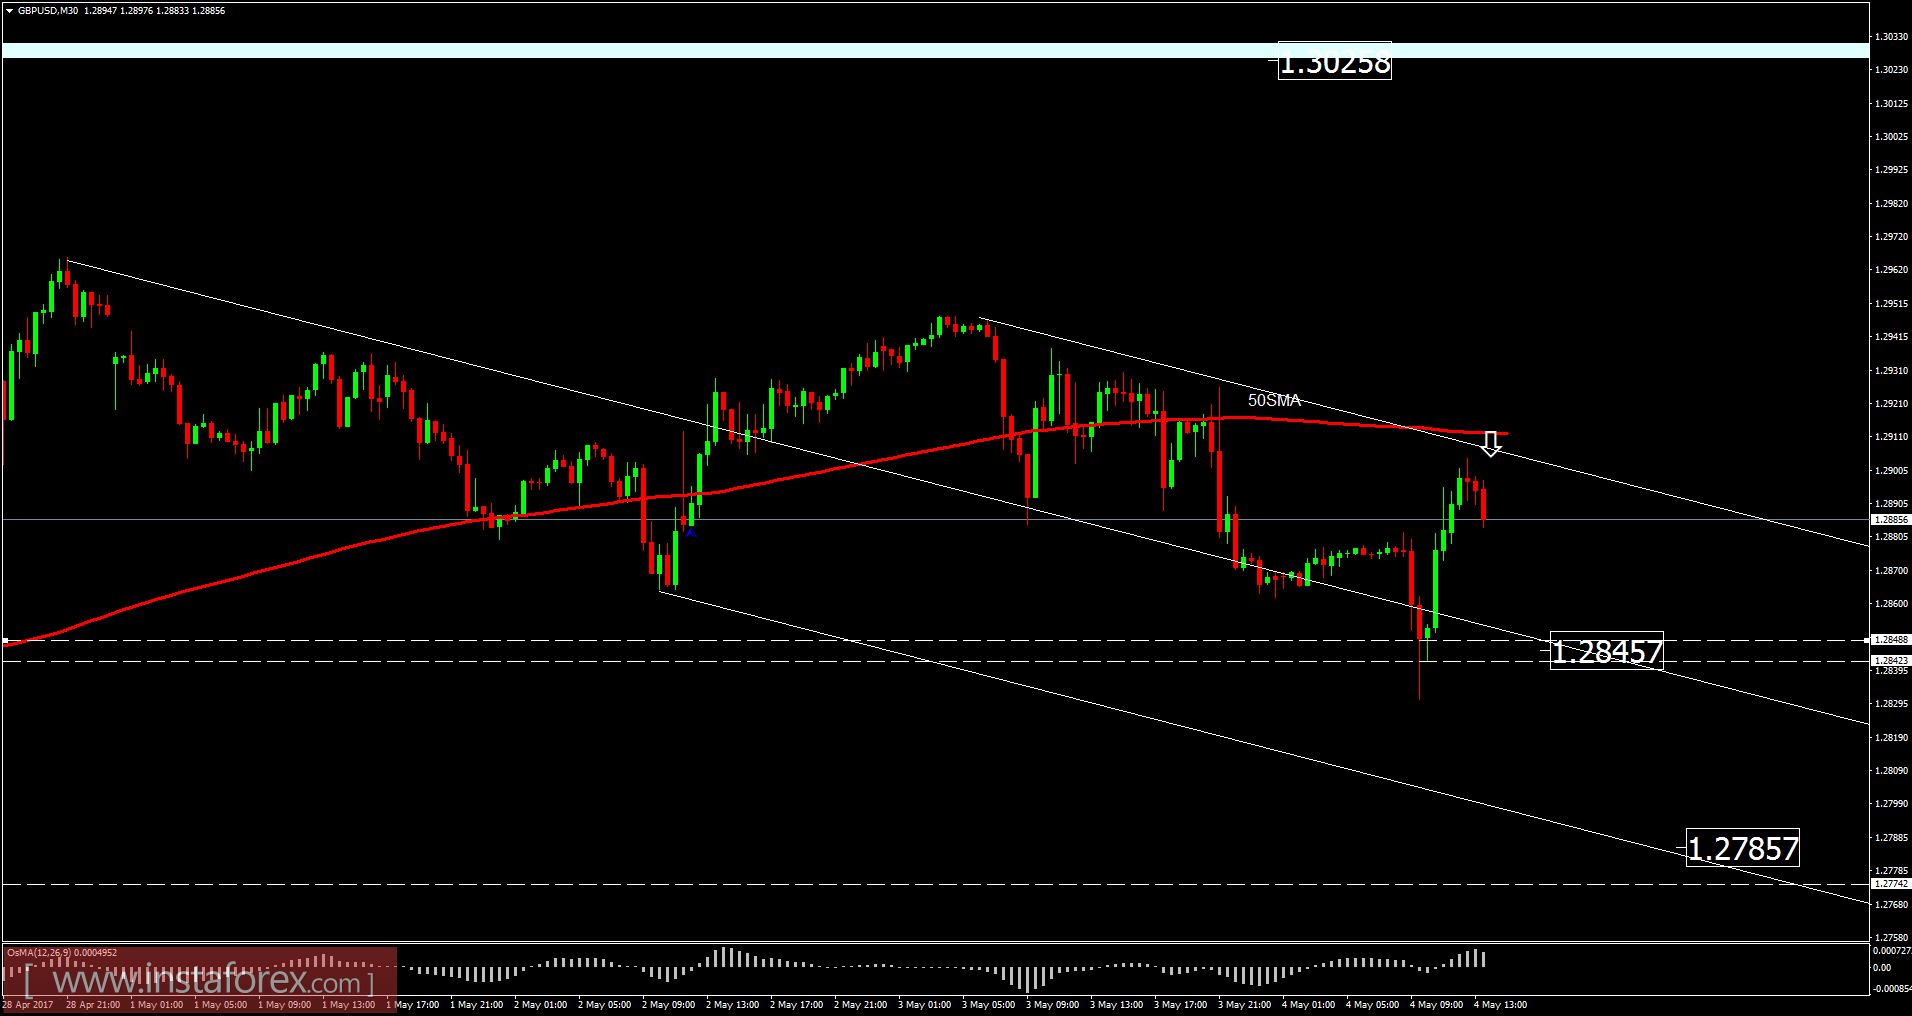
Recently, the GBP/USD pair has been trading sideways at the price of 1.2885. According to the 30M time frame, I found that price is trading inside of the downward channel, which is a sign that sellers are in control. The price respected the upper diagonal of the downward channel, which is a sign that buying looks risky. My advice is to watch for potential selling opportunties. I epxect re-test of the previous swing low at 1.2845. If the price breaks the previous swing low, second target will be set at the price of 1.2785.
Resistance levels:
R1: 1.2900
R2: 1.2923
R3: 1.2950
Support levels:
S1: 1.2850
S2: 1.2835
S3: 1.2805
Trading recommendations for today: watch for potential selling opportunities.