 English
  Русский
 Bahasa Indonesia
 Bahasa Malay
 ไทย
ไทย Español
 Deutsch
 Български
 Français
 Tiếng Việt
 中文
中文 বাংলা
বাংলা हिन्दी
 Čeština
 Українська
 Română

GBP/USD managed to rebound above the 200 SMA on H1 chart amid a broad-based weakness in the US Dollar. The pair is still trapped in a range established since April 28th. Now the pair aims to test the resistance zone of 1.2957 once again. If it manages to break above that area, we can expect further advances toward the 1.3029 level.
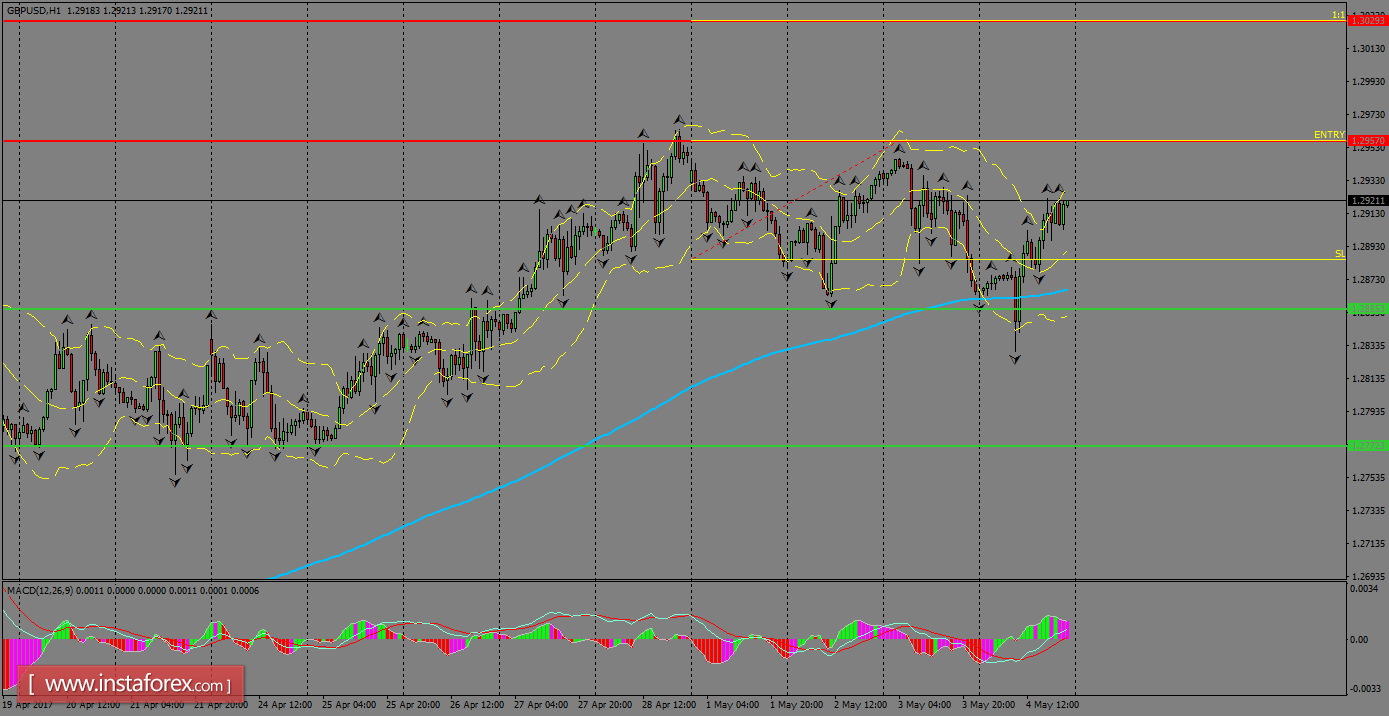
H1 chart's resistance levels: 1.2957 / 1.3029
H1 chart's support levels: 1.2855 / 1.2652
Trading recommendations for today: Based on the H1 chart, buy (long) orders only if the GBP/USD pair breaks a bullish candlestick; the resistance level is at 1.2957, take profit is at 1.3029 and stop loss is at 1.2887.