 English
  Русский
 Bahasa Indonesia
 Bahasa Malay
 ไทย
ไทย Español
 Deutsch
 Български
 Français
 Tiếng Việt
 中文
中文 বাংলা
বাংলা हिन्दी
 Čeština
 Українська
 Română

As the US fundamental data on Thursday discouraged investors and the Healthcare bill passed the House, USDX received a strong selling wave below the 200 SMA on H1 chart, which enabled the greenback to cap gains in the short term. Now, the index is piercing the support level of 98.83 and now it is heading for the 98.42 level, which is our next key area to the downside.
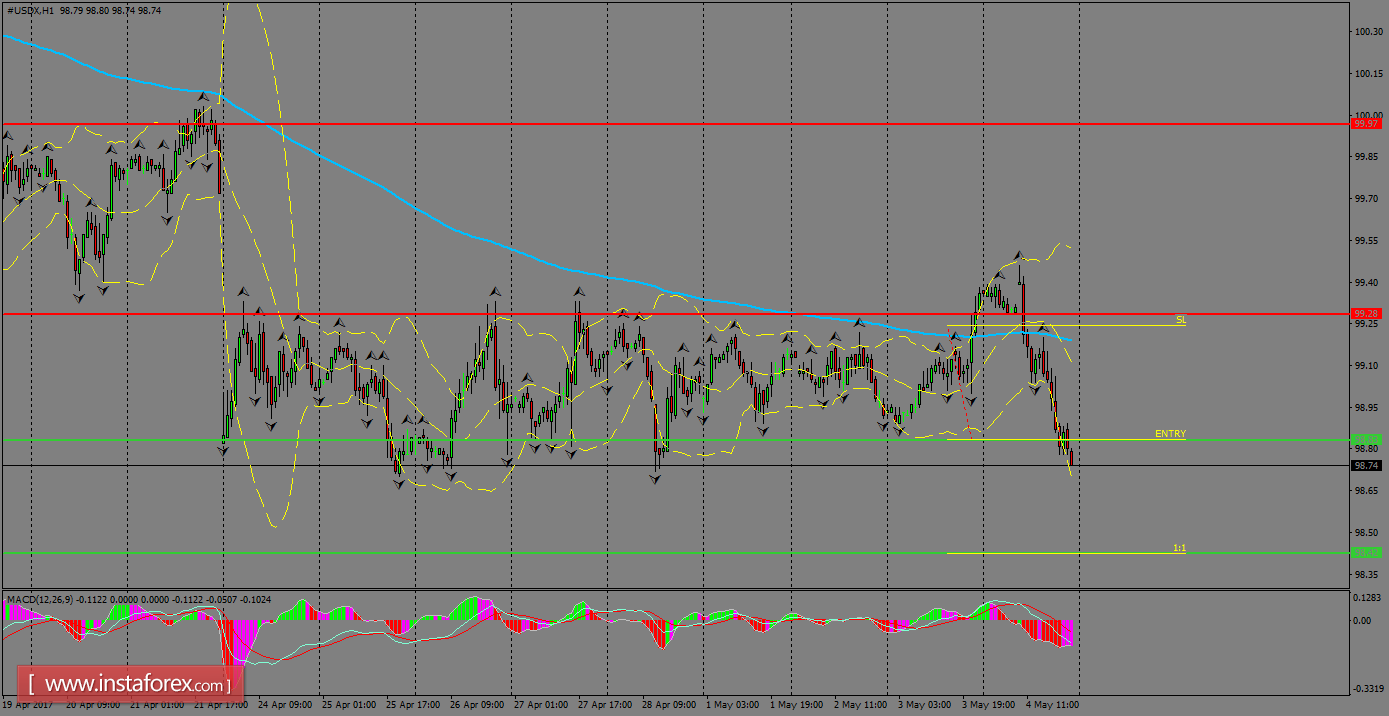
H1 chart's resistance levels: 99.28 / 99.97
H1 chart's support levels: 98.83 / 98.42
Trading recommendations for today: Based on the H1 chart, place sell (short) orders only if the USD Index breaks with a bearish candlestick; the support level is at 98.83, take profit is at 98.42 and stop loss is at 99.24.