 English
  Русский
 Bahasa Indonesia
 Bahasa Malay
 ไทย
ไทย Español
 Deutsch
 Български
 Français
 Tiếng Việt
 中文
中文 বাংলা
বাংলা हिन्दी
 Čeština
 Українська
 Română

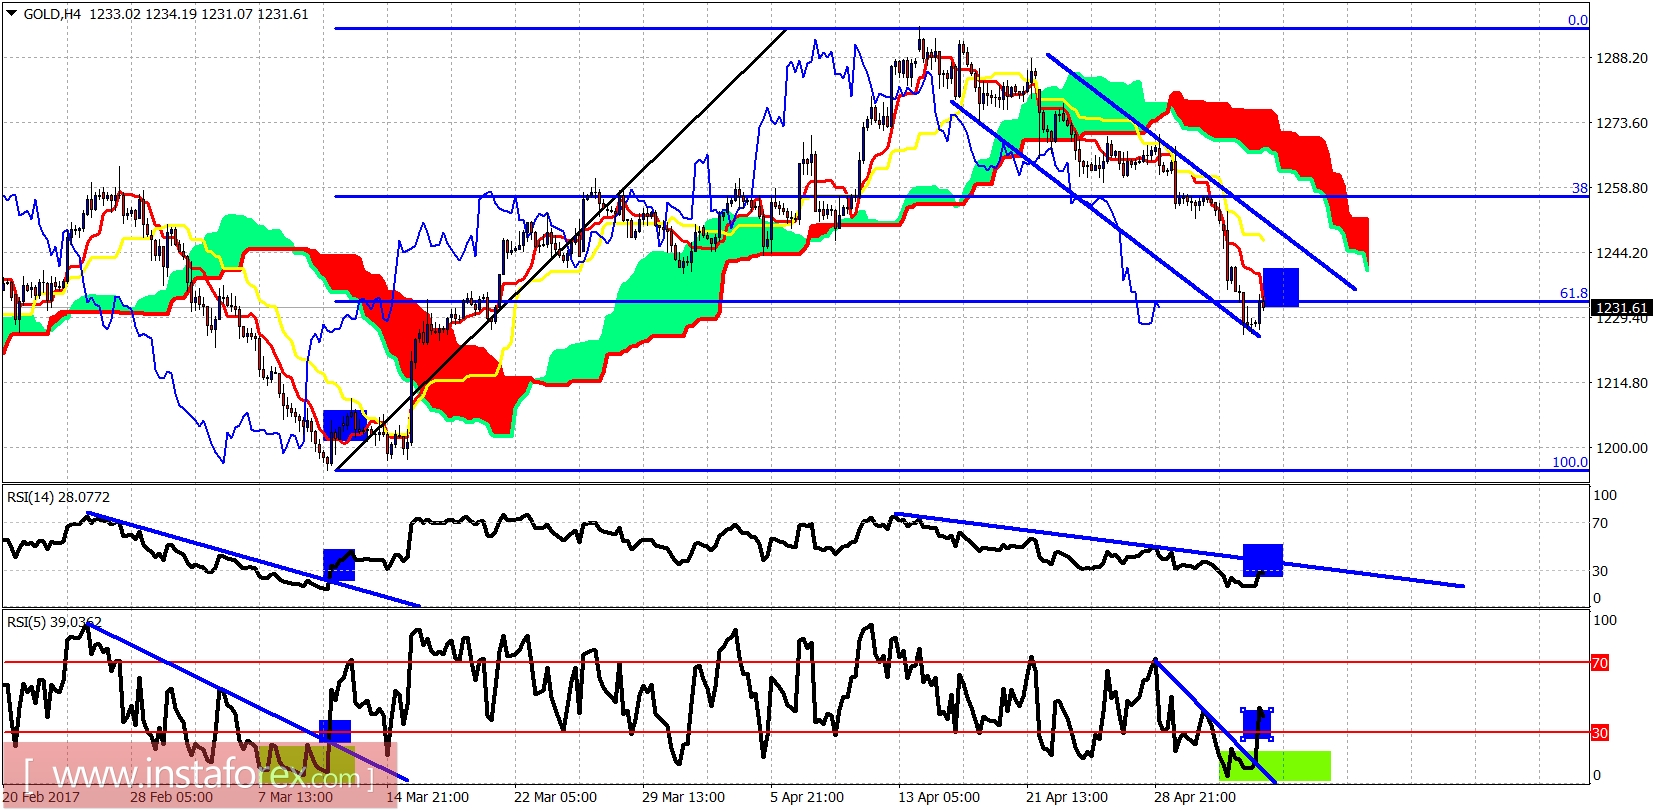
Gold price has broken to new lows yesterday but is very close to making an important bottom reversal if it has not already bottomed. Gold price should bounce at least towards $1,260-70. There are many signs of bullish divergence and similar to when Gold was at $1,194.
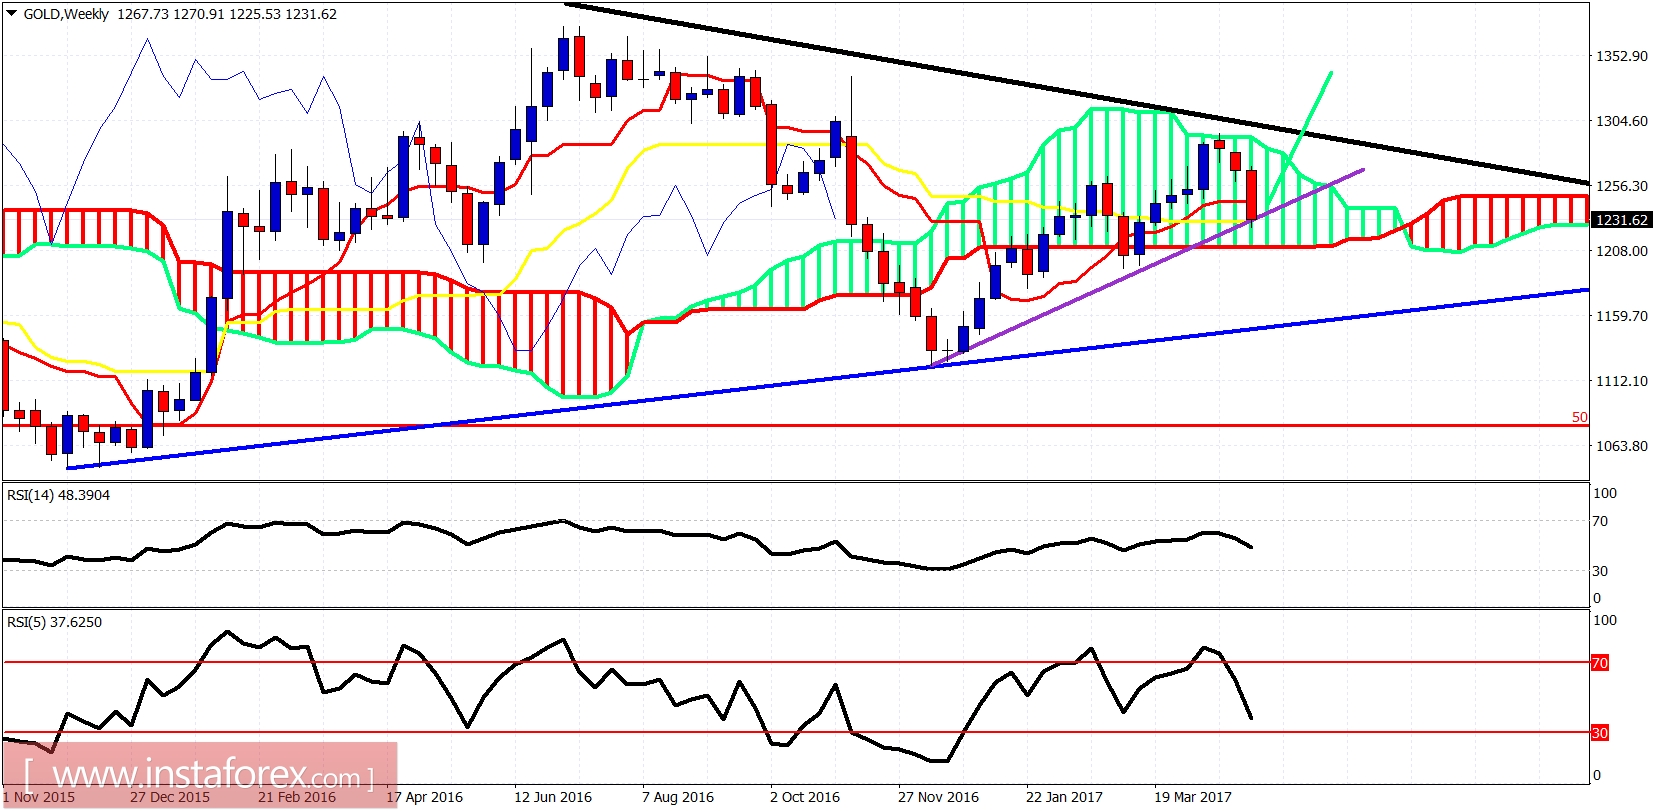
Purple line - support
Blue line -long-term support
Black line - long-term resistance
Gold price was rejected a couple weeks ago at the long-term resistance trend line and the upper cloud boundary. Price is now testing the purple trend line support and the weekly kijun-sen (yellow line indicator). A bounce is expected from current levels. However, a break below $1,220-$1,210 on a weekly basis will imply that Gold should move even lower towards $1,160. My long-term view remains bullish expecting Gold towards $1,500.