 English
  Русский
 Bahasa Indonesia
 Bahasa Malay
 ไทย
ไทย Español
 Deutsch
 Български
 Français
 Tiếng Việt
 中文
中文 বাংলা
বাংলা हिन्दी
 Čeština
 Українська
 Română

GBP/USD struggled to reach the psychological level of 1.3000 and remains well consolidated below the 1.2950 zone. Currently, the price action points to test the 200 SMA on H1 chart, where a dynamic support can be found in the short term. Around that area, we can expect further bullish momentum in the Cable in order to test the 1.3030 level in coming days.
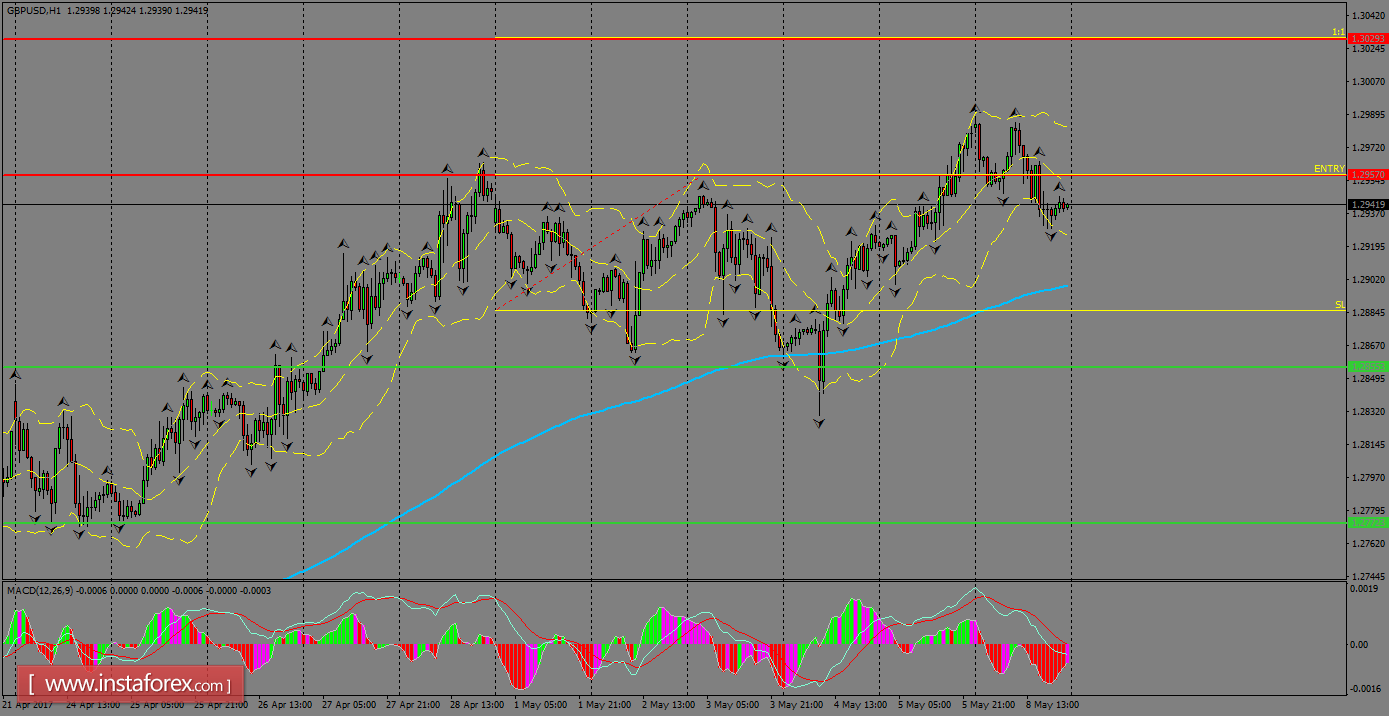
H1 chart's resistance levels: 1.2957 / 1.3029
H1 chart's support levels: 1.2855 / 1.2652
Trading recommendations for today: Based on the H1 chart, buy (long) orders only if the GBP/USD pair breaks a bullish candlestick; the resistance level is at 1.2957, take profit is at 1.3029 and stop loss is at 1.2887.