 English
  Русский
 Bahasa Indonesia
 Bahasa Malay
 ไทย
ไทย Español
 Deutsch
 Български
 Français
 Tiếng Việt
 中文
中文 বাংলা
বাংলা हिन्दी
 Čeština
 Українська
 Română

The Dollar index is bouncing as we expected from our last post. Price is now trying to break above the 4-hour Kumo resistance and move towards the first Fibonacci retracement level of importance at 99.60.
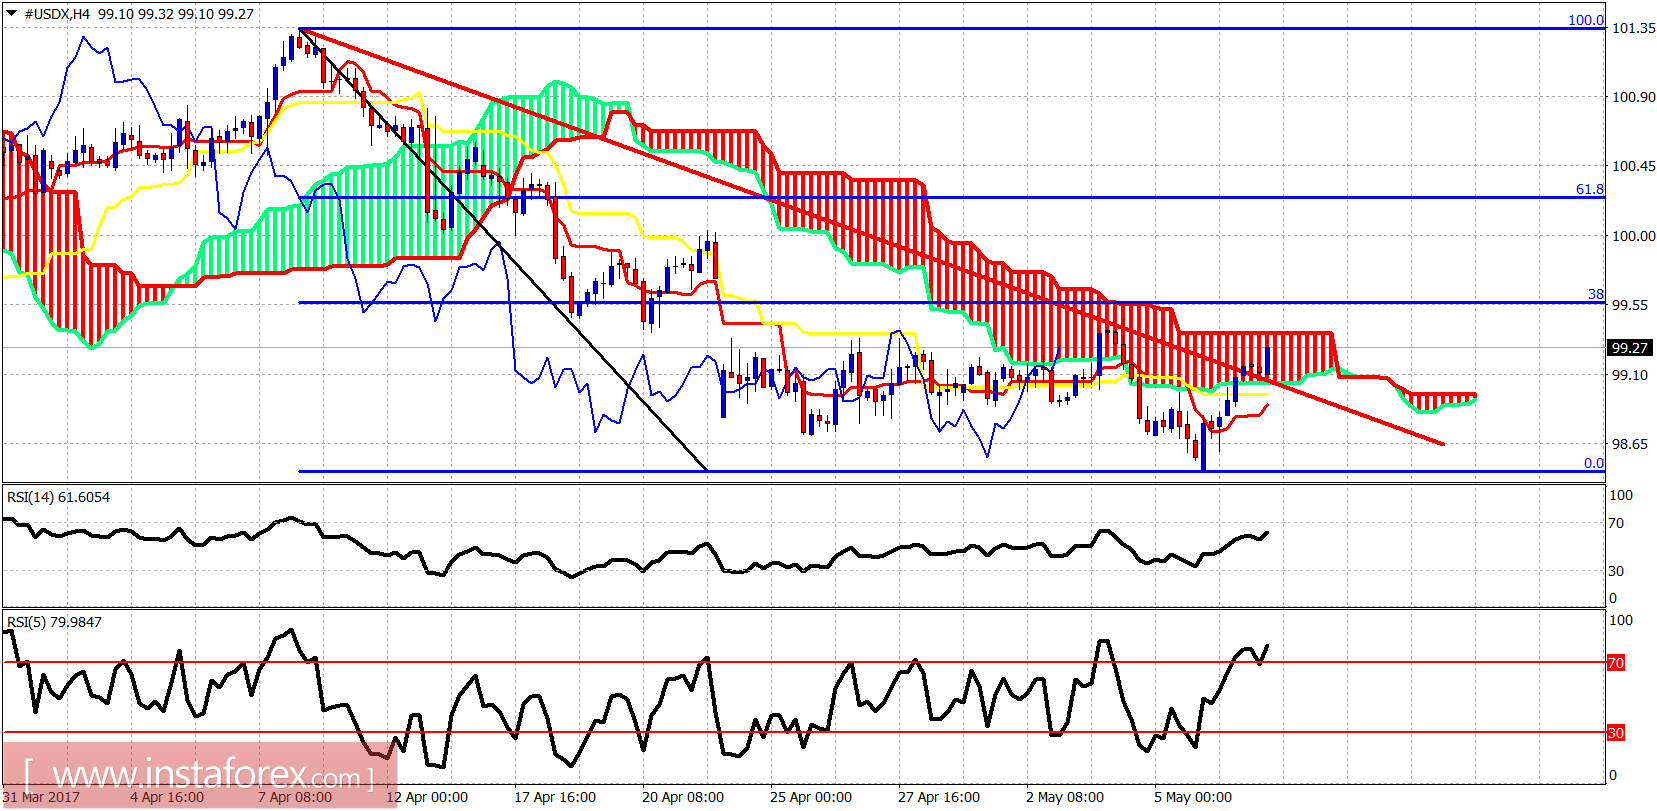
Red line - resistance
The Dollar index has broken above the red trend line resistance. Trend is neutral in the 4-hour chart as price is inside the 4-hour Kumo. Important short-term resistance is at 99.37 and 99.60. The upper cloud boundary and the 38% Fibonacci retracement are the levels to watch.
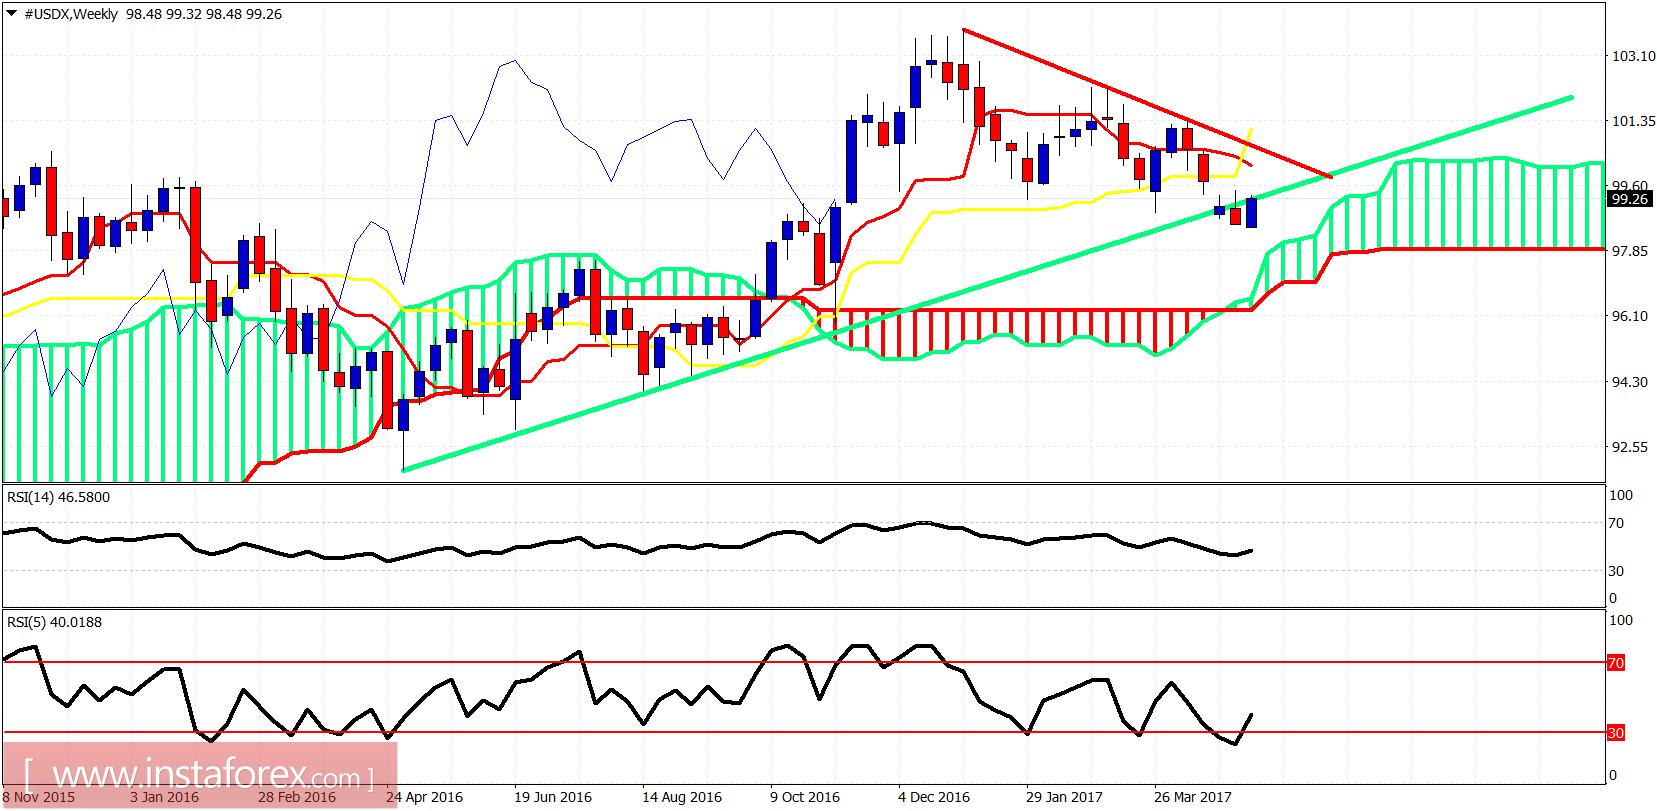
Green line - support
The Dollar index has broken below the green long-term trend line support and is now trying to get back inside. The bounce was justified and awaited since last week. Resistance is at 100.20 (tenkan-sen) and at 100.60 (red trend line). Support is at 97.50 at the weekly upper Kumo boundary.