 English
  Русский
 Bahasa Indonesia
 Bahasa Malay
 ไทย
ไทย Español
 Deutsch
 Български
 Français
 Tiếng Việt
 中文
中文 বাংলা
বাংলা हिन्दी
 Čeština
 Українська
 Română

The pair had a bearish session during Tuesday but it remained above the 200 SMA at H1 chart, which still provides a nice dynamic support across the board. The key resistance of 1.2957 is still a hurdle to overcome in order to reach the psychological area of 1.3000. That scenario is likely to prove valid, as the price action isn't showing new lower low patterns' formations.
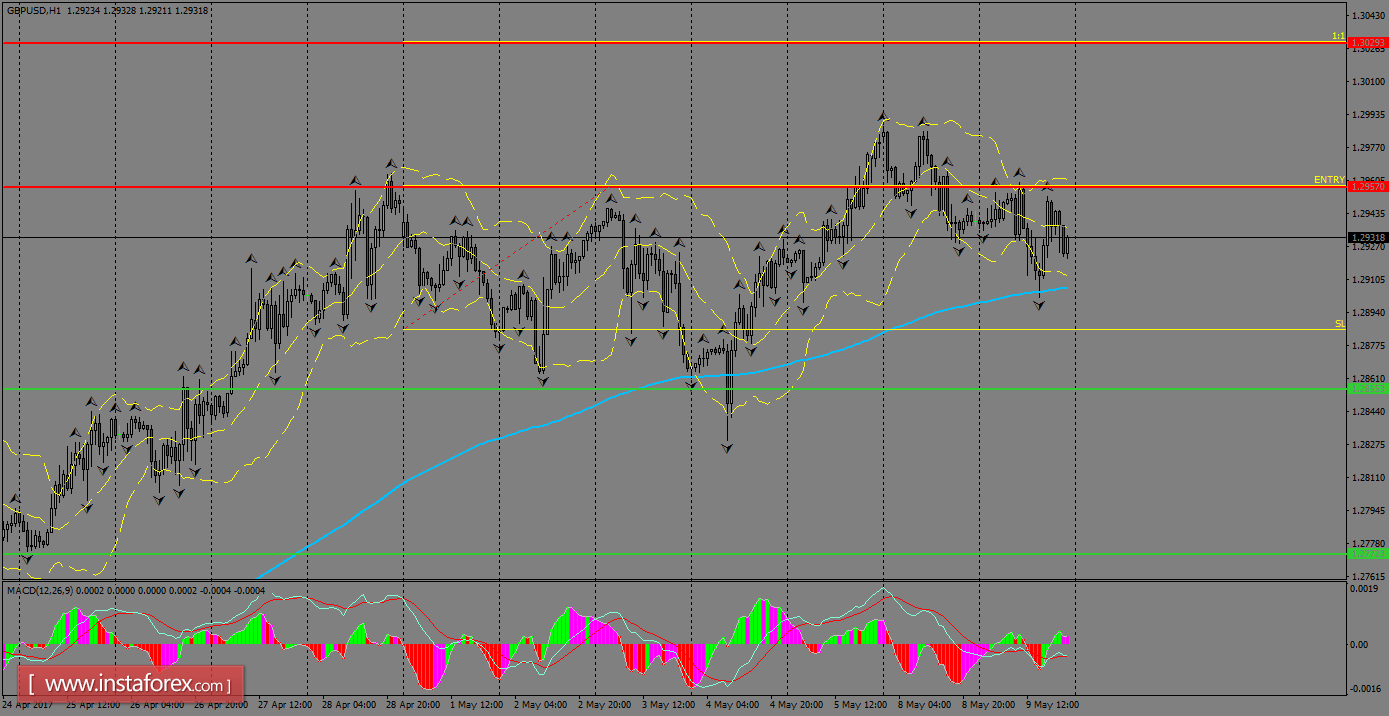
H1 chart's resistance levels: 1.2957 / 1.3029
H1 chart's support levels: 1.2855 / 1.2652
Trading recommendations for today: Based on the H1 chart, place buy (long) orders only if the GBP/USD pair breaks a bullish candlestick; the resistance level lies at 1.2957, take profit is at 1.3029 and stop loss is at 1.2887.