 English
  Русский
 Bahasa Indonesia
 Bahasa Malay
 ไทย
ไทย Español
 Deutsch
 Български
 Français
 Tiếng Việt
 中文
中文 বাংলা
বাংলা हिन्दी
 Čeština
 Українська
 Română

USDX continues to strengthen in the short term and it's approaching the 100.00 handle. With a consolidation above the 200 SMA at H1 chart, we can expect further rallies to reach that psychological zone. As the current move was done within an impulse, a pullback can happen towards the support zone of 99.23. MACD indicator is turning flat, calling for sideways in the index.
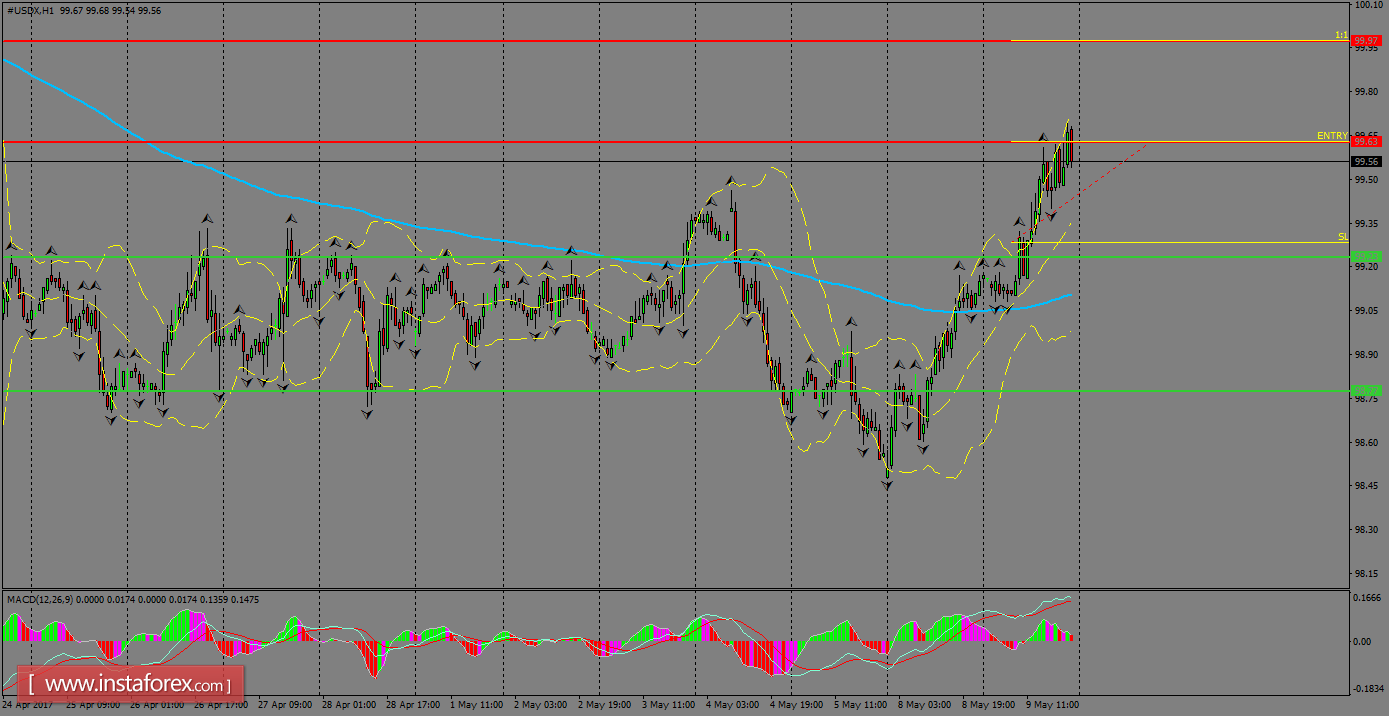
H1 chart's resistance levels: 99.63 / 99.97
H1 chart's support levels: 99.23 / 98.77
Trading recommendations for today: Based on the H1 chart, place buy (long) orders only if the USD index breaks a bullish candlestick; the resistance level is at 99.63, take profit lies at 99.97 and stop loss is at 99.28.