 English
  Русский
 Bahasa Indonesia
 Bahasa Malay
 ไทย
ไทย Español
 Deutsch
 Български
 Français
 Tiếng Việt
 中文
中文 বাংলা
বাংলা हिन्दी
 Čeština
 Українська
 Română

The US dollar index bounced yesterday, as expected, and reached our first target at 99.50 where the 38% Fibonacci retracement resistance is found. A clear daily break above 99.60 will open the way towards 100.20 as the price has broken above the 4 hour cloud resistance.
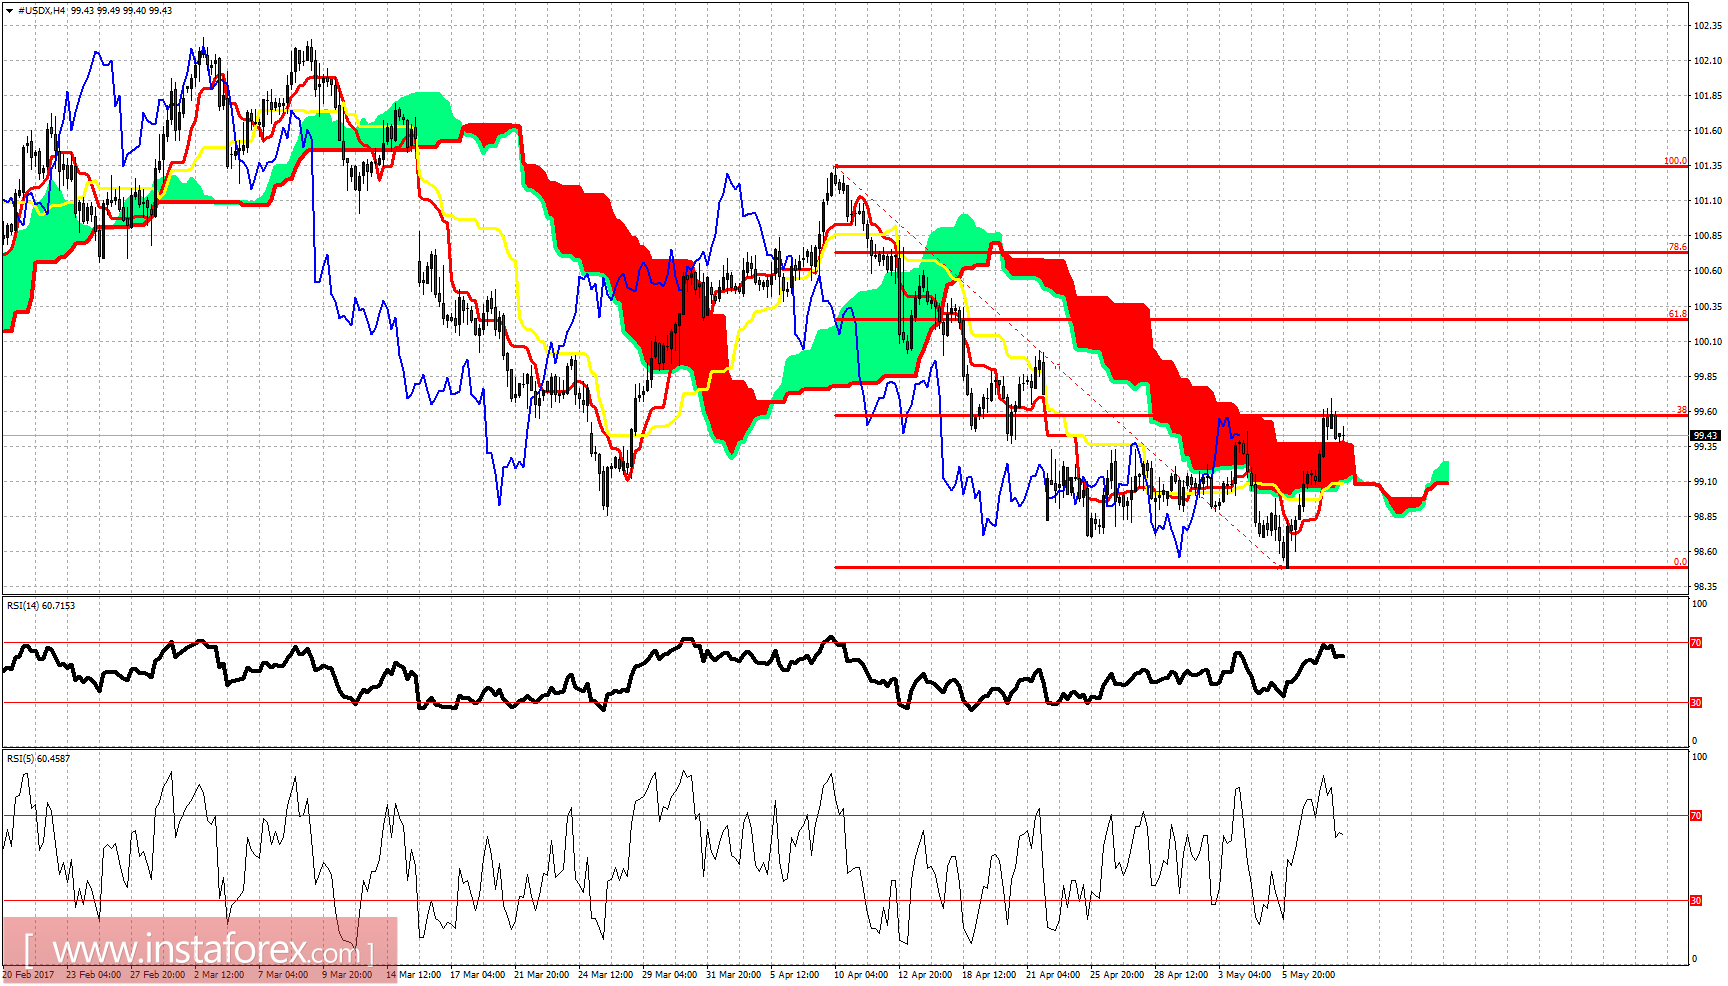
Black line - long-term trend line support
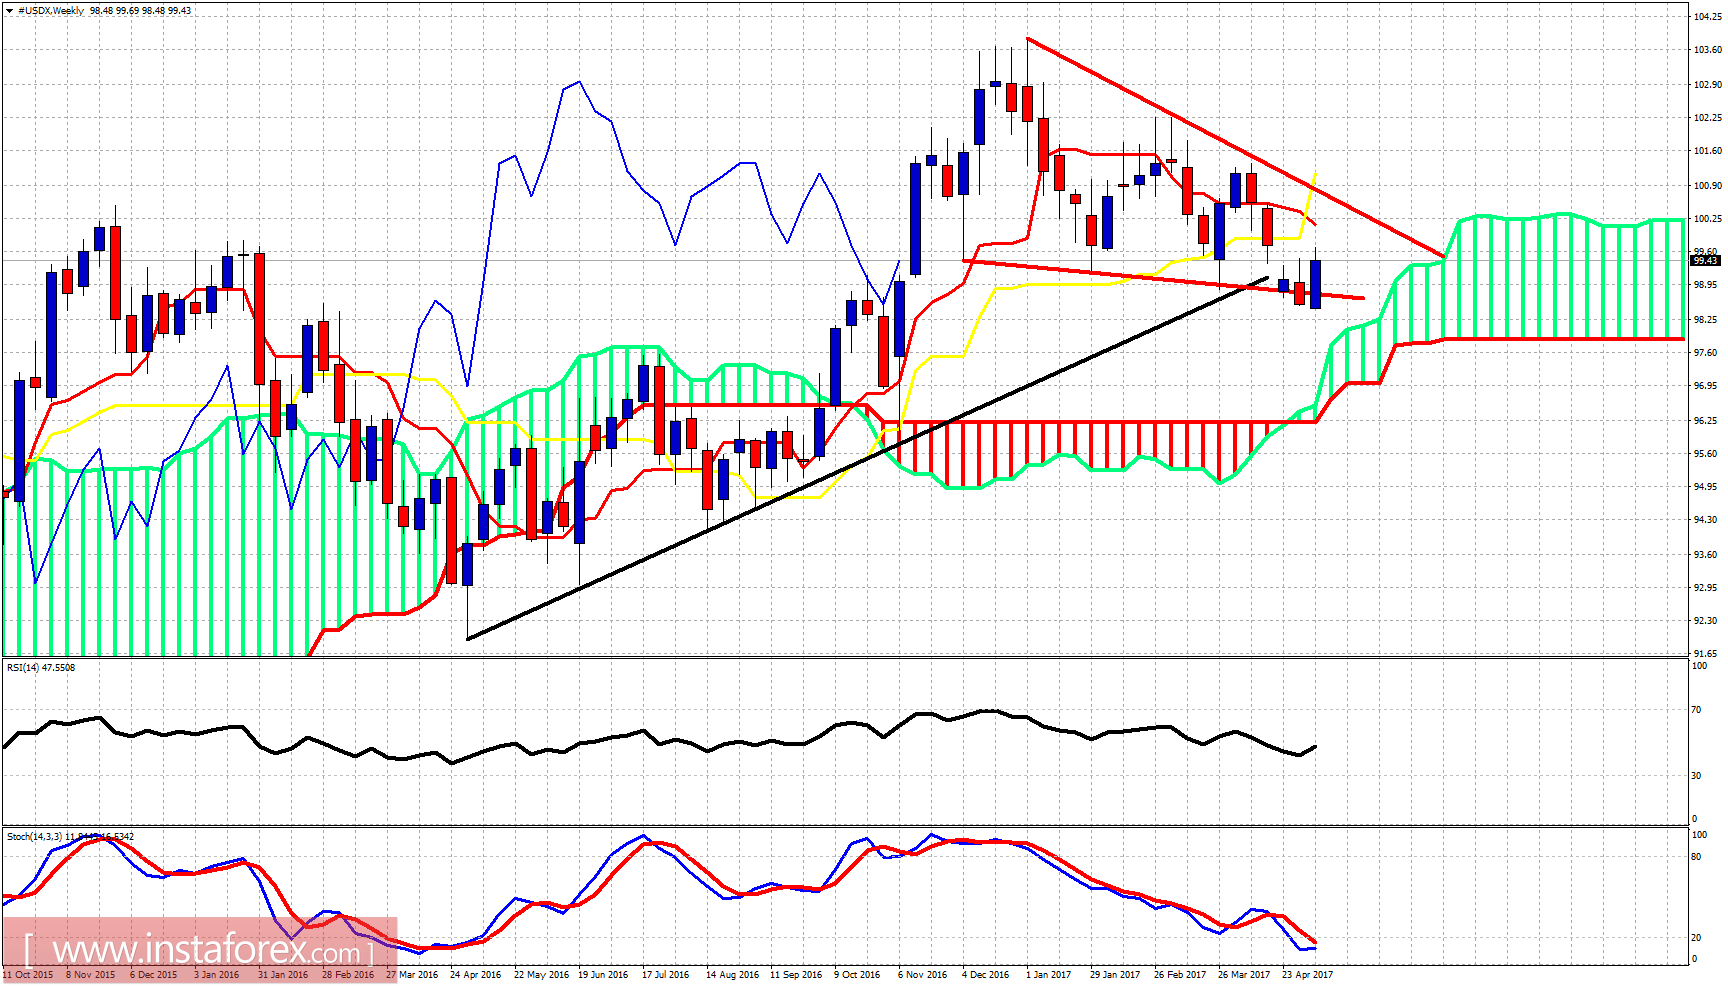
USDX remains inside the triangle pattern and above the weekly Kumo. The price is bouncing as expected and could even reach the upper triangle boundary resistance at 100.30. Only a break above the 100.30 and 101.30 will confirm that an important low is forming and that a new up trend has started.