 English
  Русский
 Bahasa Indonesia
 Bahasa Malay
 ไทย
ไทย Español
 Deutsch
 Български
 Français
 Tiếng Việt
 中文
中文 বাংলা
বাংলা हिन्दी
 Čeština
 Українська
 Română

Gold price is bouncing and trying to break out of the bearish channel. Trend remains bearish as price is below the 4-hour Kumo. Important resistance levels ahead at $1,245 and at $1,260 must be broken so that the bullish scenario of $1,300-$1,400 is realized.
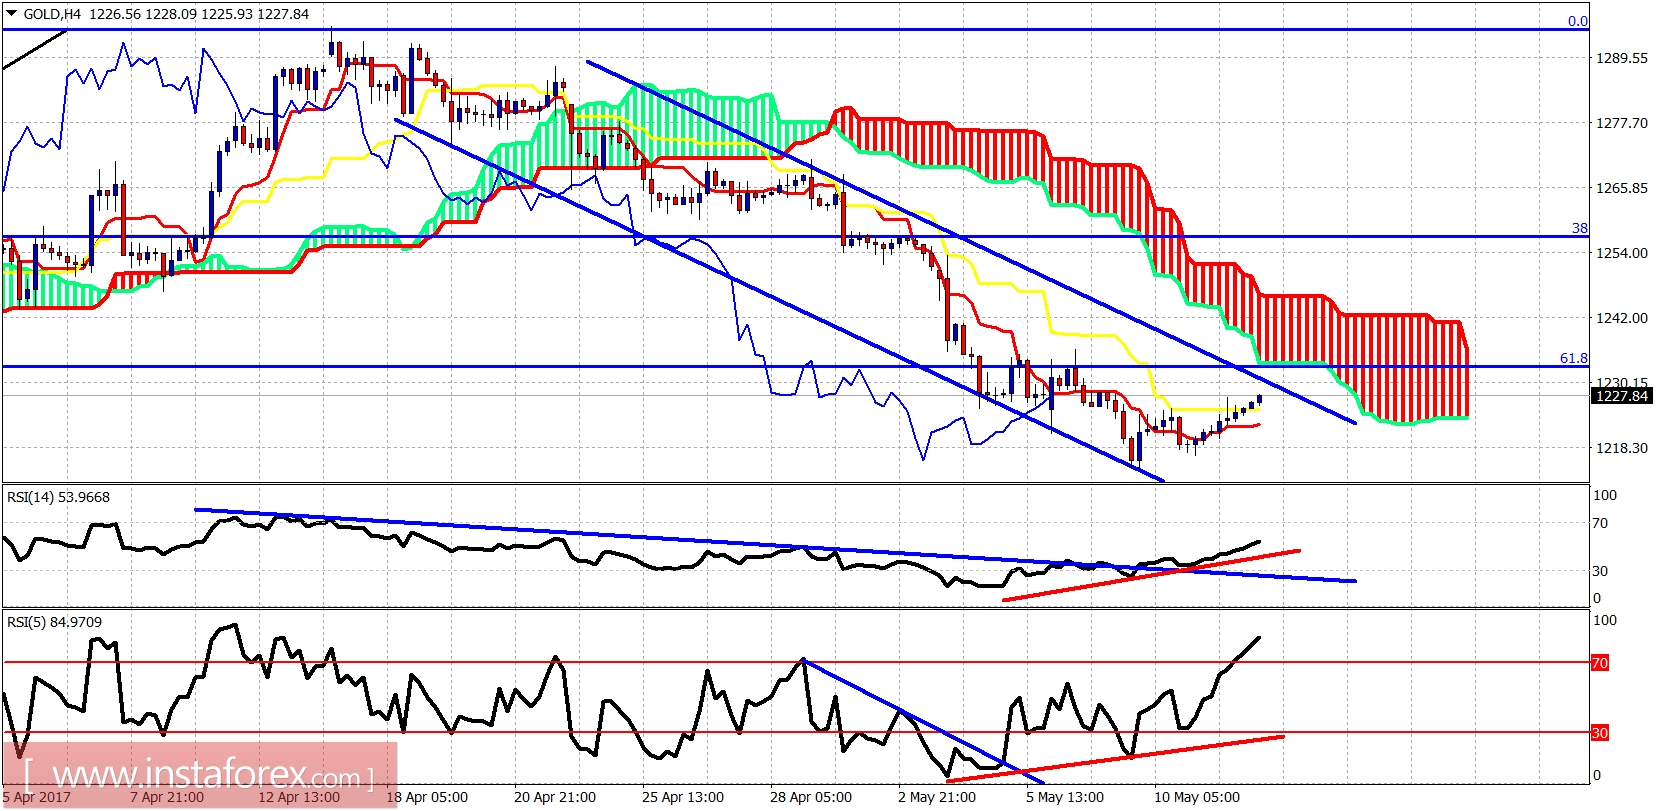
Gold price is breaking above the tenkan- and kijun-sen indicators on the 4-hour chart. Price remains below the Kumo and is still inside the bearish channel. Trend remains bearish. Short-term resistance is at $1,230 but the most important level is at $1,245 and at $1,260.
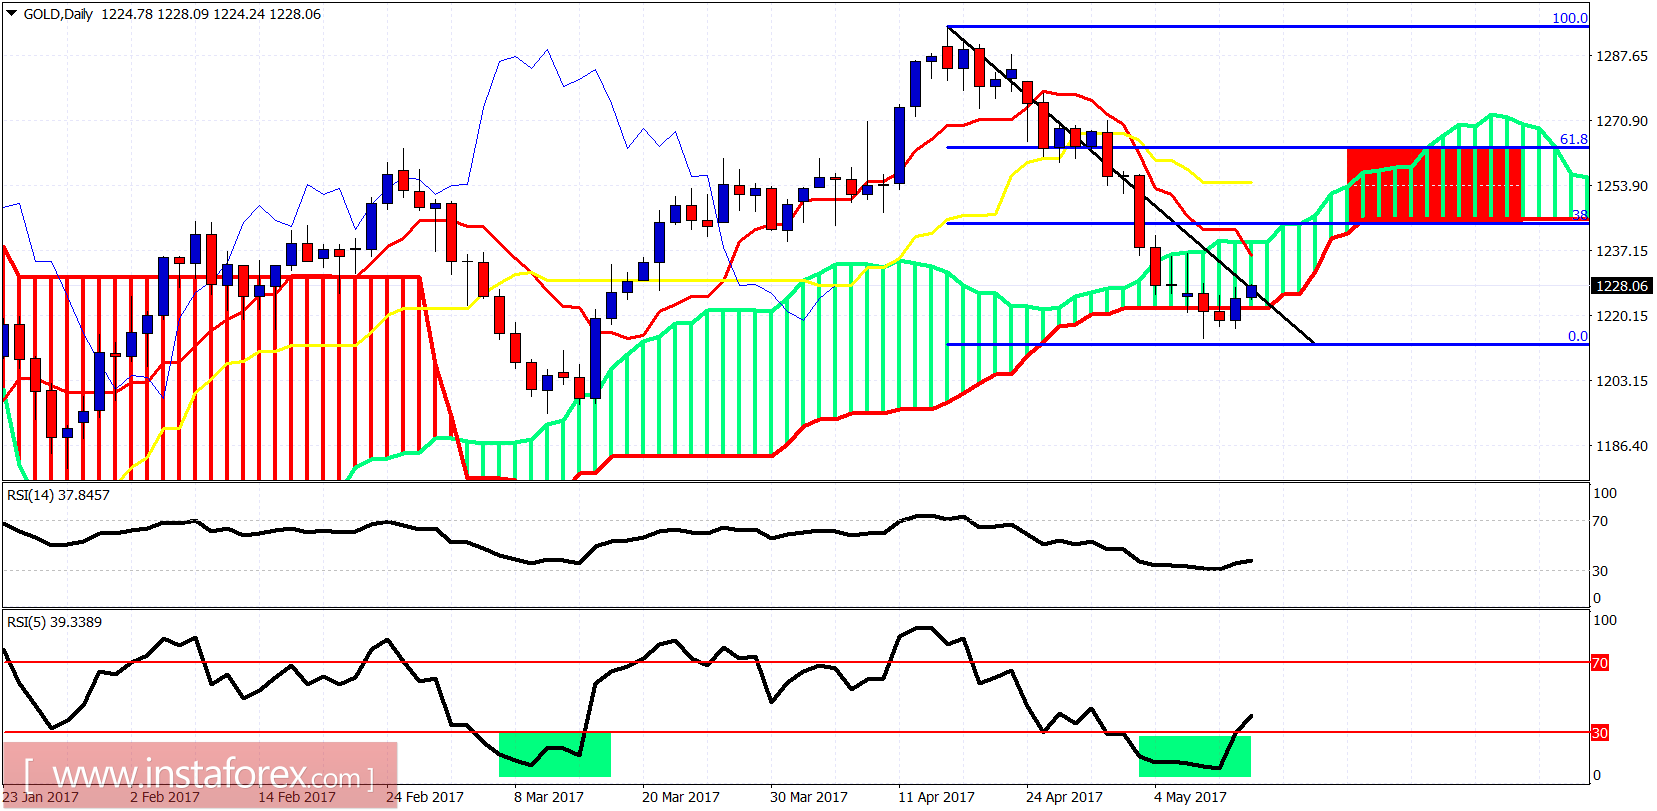
target is between $1,240 and $1,260. Breaking above it will open the way for a bullish move above $1,300.